
TOP Trend Breakout Levels
for Trend Breakout Trading
Strategy
The TOP Trend Breakout Levels indicator is a trend based breakout strategy designed to analyze and display the highest high breakout level and lowest low breakout level for a defined look back period. Trend breakout strategies have been popular with traders who have a longer-term focus in the markets.
Designed for Stocks, Bonds, Commodities, Futures, FOREX, and Options trading. TOP Trend Breakout Levels is a powerful tool that can be used for Day Trading, Swing Trading, and for strategic entry Trend Trading! Effective on both intraday and end-of-day price charts including 5 minute charts, 60 minute charts, daily charts, weekly charts, and tick charts to name a few.
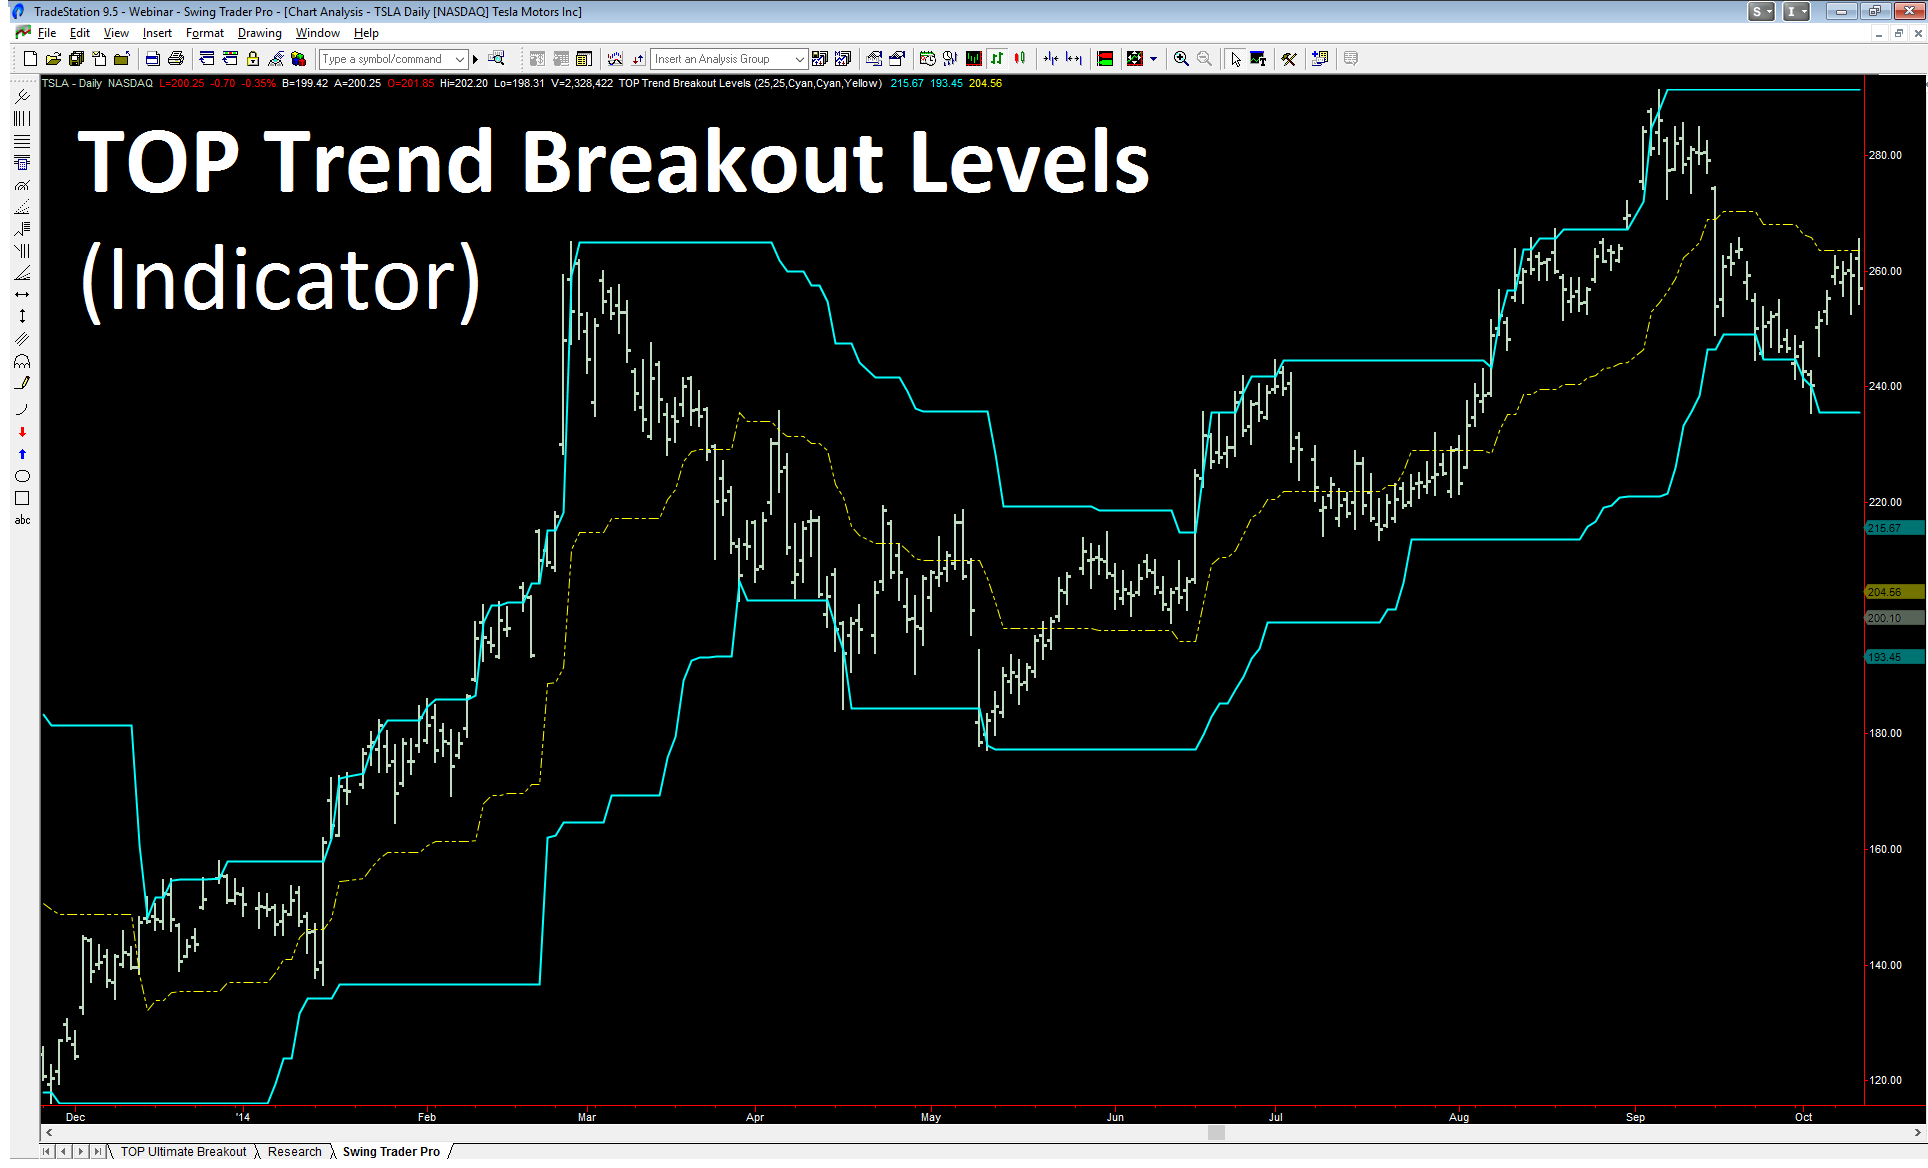
Breakout strategies have been one of the most time tested methods to trade market trends. When breakout levels are effectively optimized, a breakout strategy can allow you to effectively enter into a strong trend and manage your position as the trend persists. When strong trends present themselves in markets over time, they can represent the best opportunities to generate windfall profits!
Risk Disclaimer: There is a risk of loss when trading and past performance is not necessarily indicative of future results.
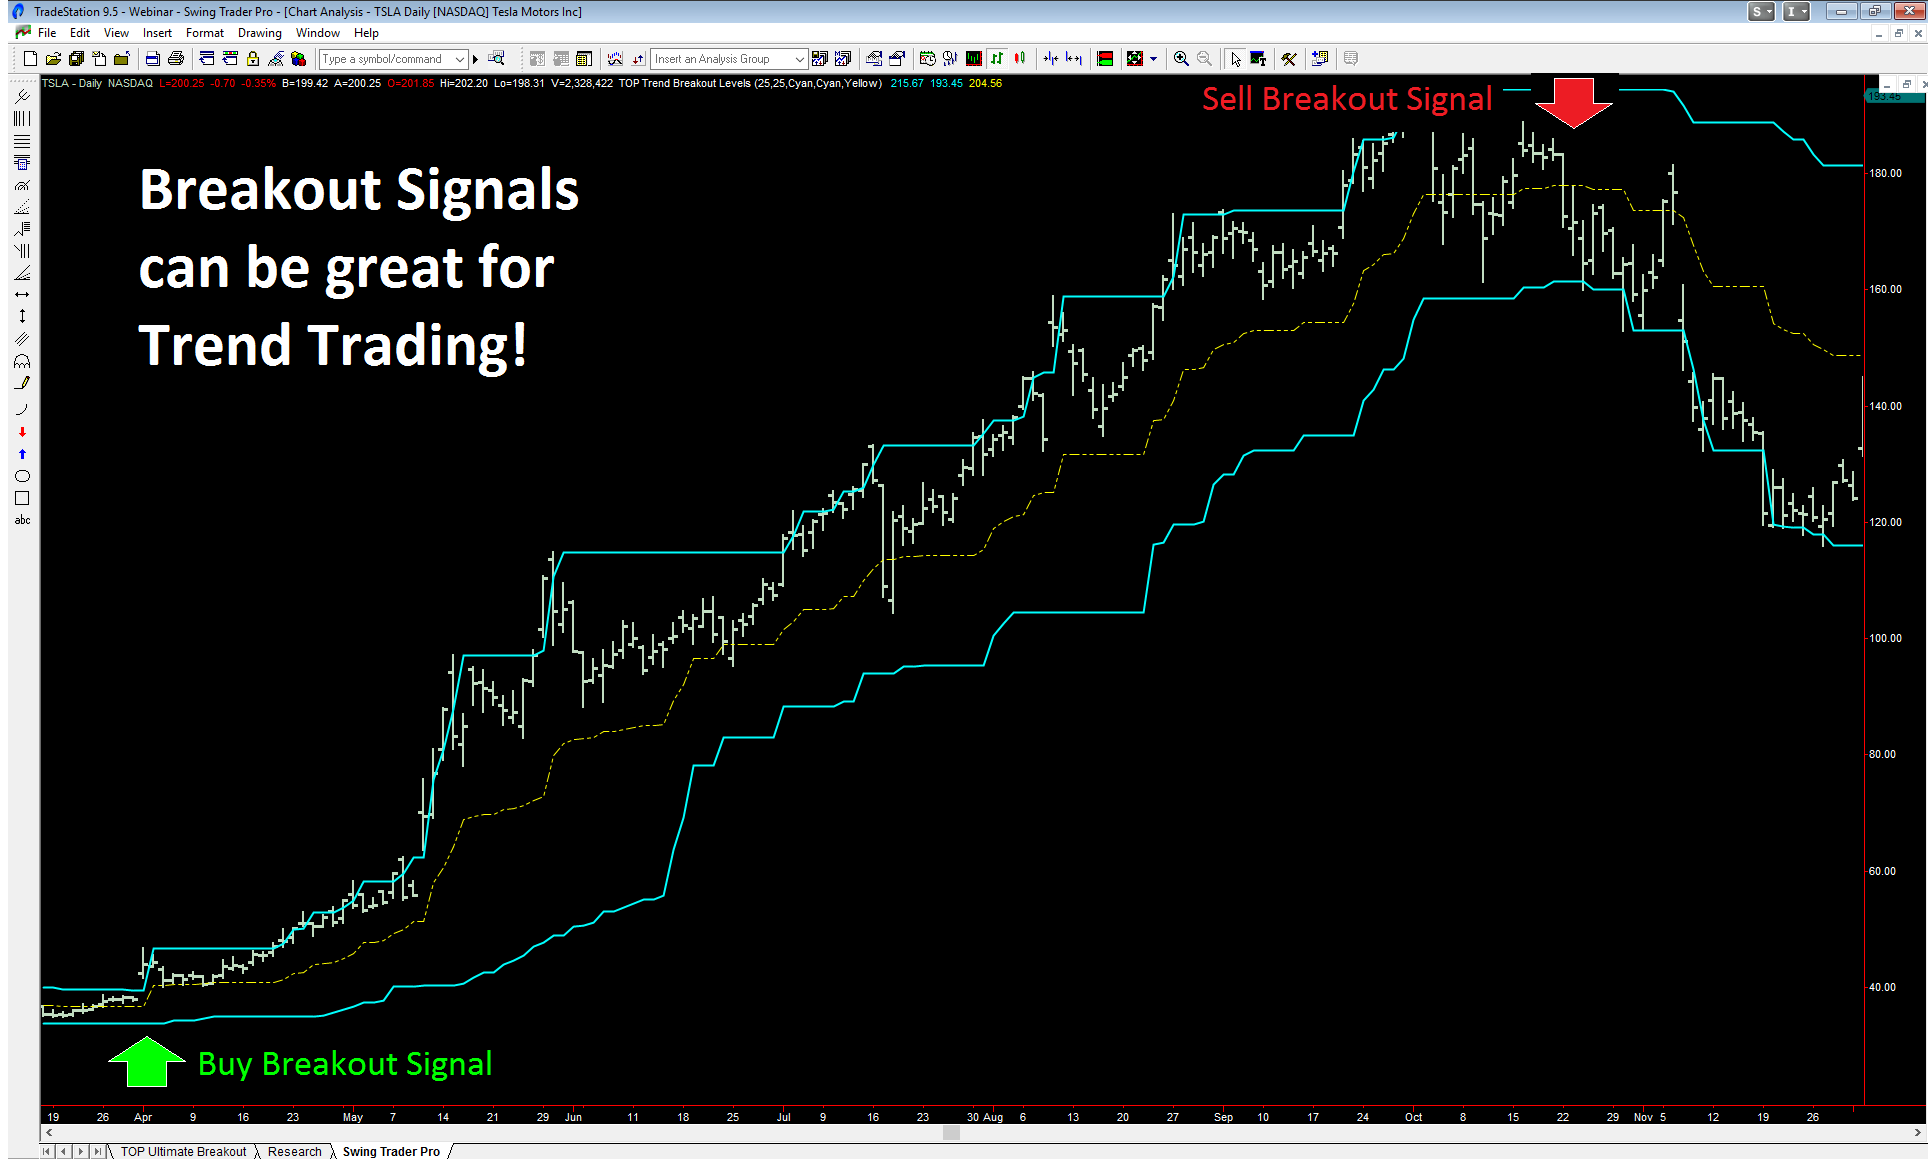
In the daily TSLA chart above, you can see that the TOP Trend Breakout Levels were effective in capturing profits from the significant up trend that unfolded over the course of six months. The TOP Trend Breakout Levels in the chart above enabled a trader to participate in the 400% increase in TSLA!
TOP Trend Breakout Levels with Trade Setups
TOP Trend Breakout Levels can be used to trade an underlying trend in any market. When combined with short-term trade setups, traders can enter markets with short-term setups and then participate in the trend by allowing the TOP Trend Breakout Levels to manage their trend position. The following chart provides a good example of this type of strategy.
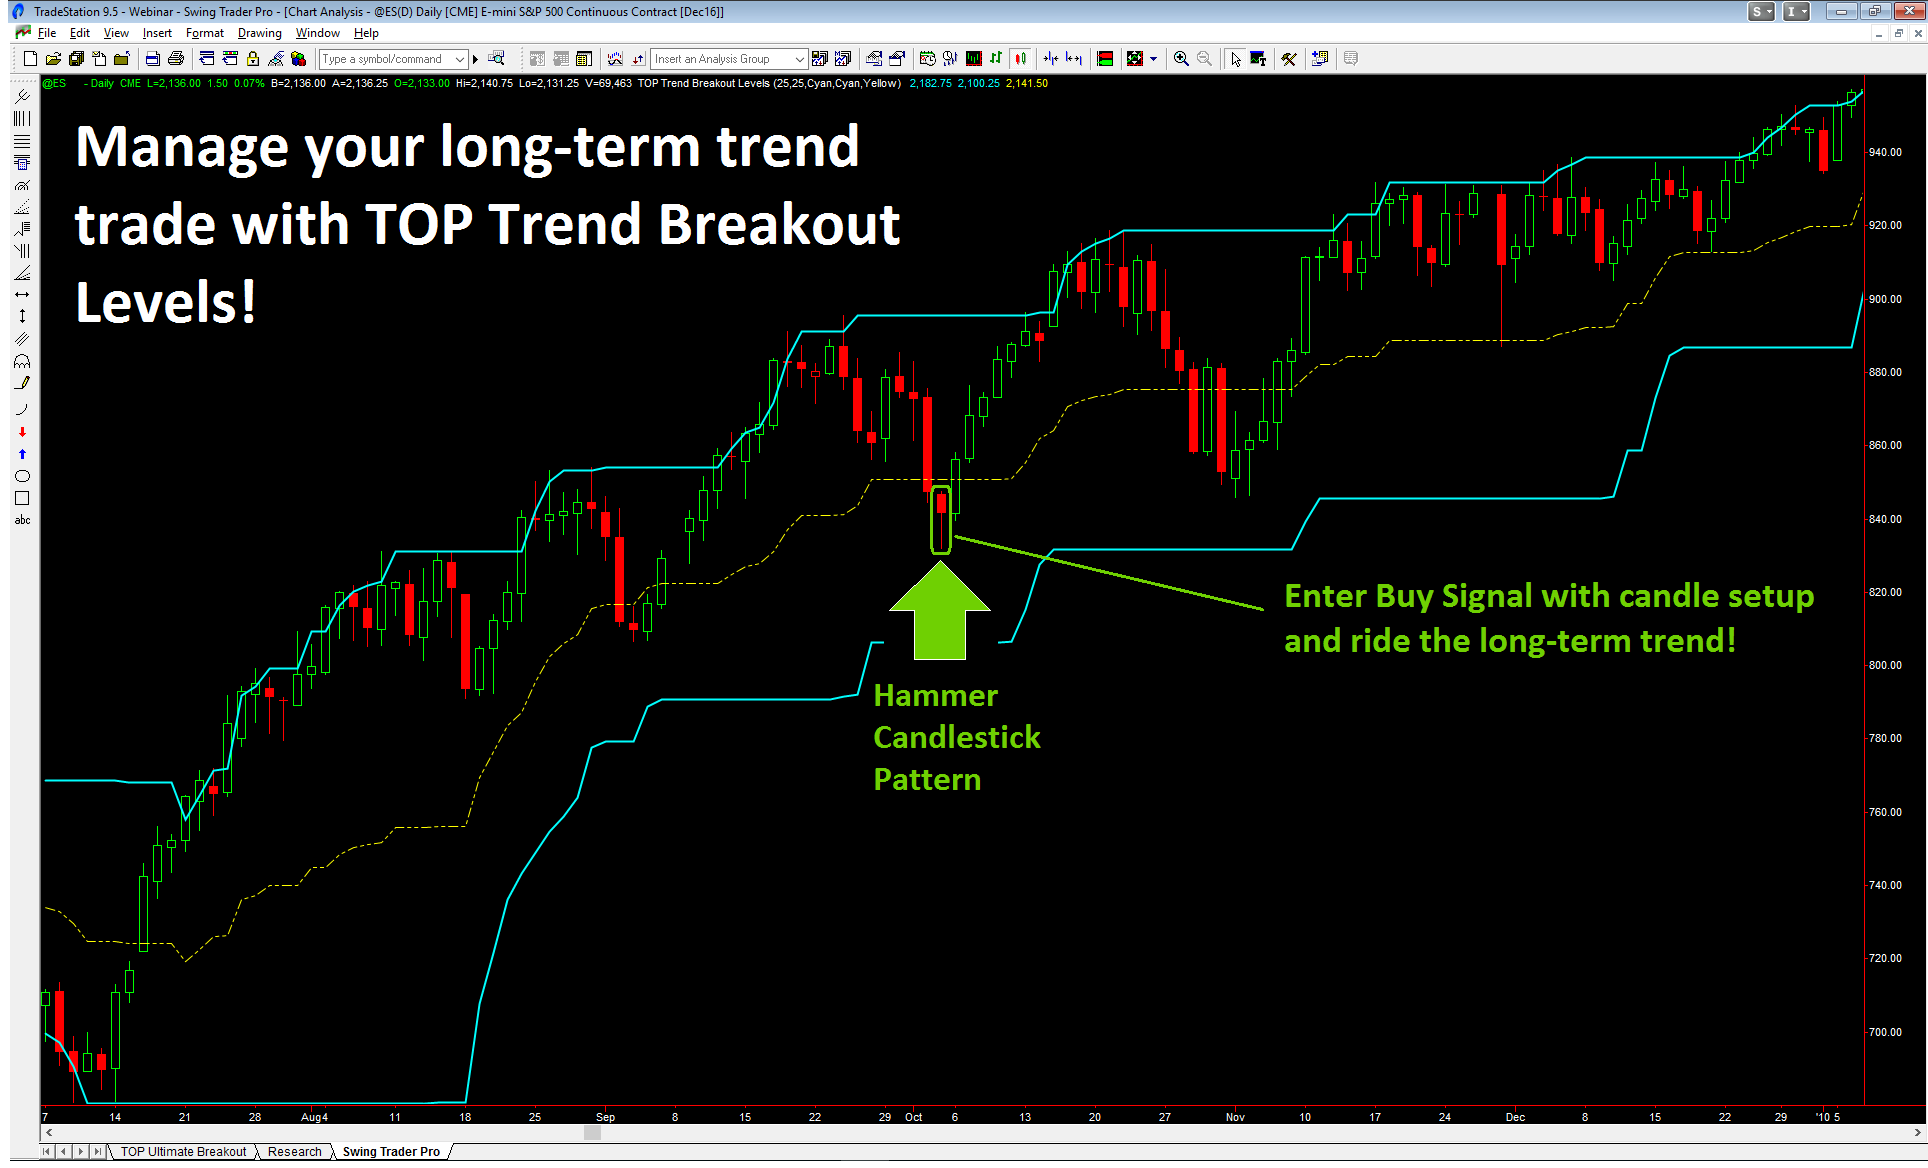
In the daily Emini S&P futures chart above, you can see how the Hammer Candlestick Pattern can be used to strategically enter the longer-term uptrend defined by the TOP Trend Breakout Levels. This means that you don’t necessarily have to enter a trend when the TOP Trend Breakout Levels generates a trade signal – you can use a shorter-term strategy to enter a longer-term trend and potentially pyramid on your long position.
It is important to note that not every TOP Trend Breakout Levels signal will lead to a large price move or profits. In fact, market trends are the exception rather than the rule. This means that trend strategies will generate false signals if a market is trading in a choppy, sideways environment. However, when trends do unfold in the markets, they can offer exceptional profit opportunities.
Using a Pyramid Strategy with TOP Trend Breakout Levels
The TOP Trend Breakout Levels can be used with a pyramid trading logic. The TOP Trend Breakout Levels can be used to identify a primary trend and a pyramid strategy can be used to generate an entry signal or pyramid signals to add to an existing position.
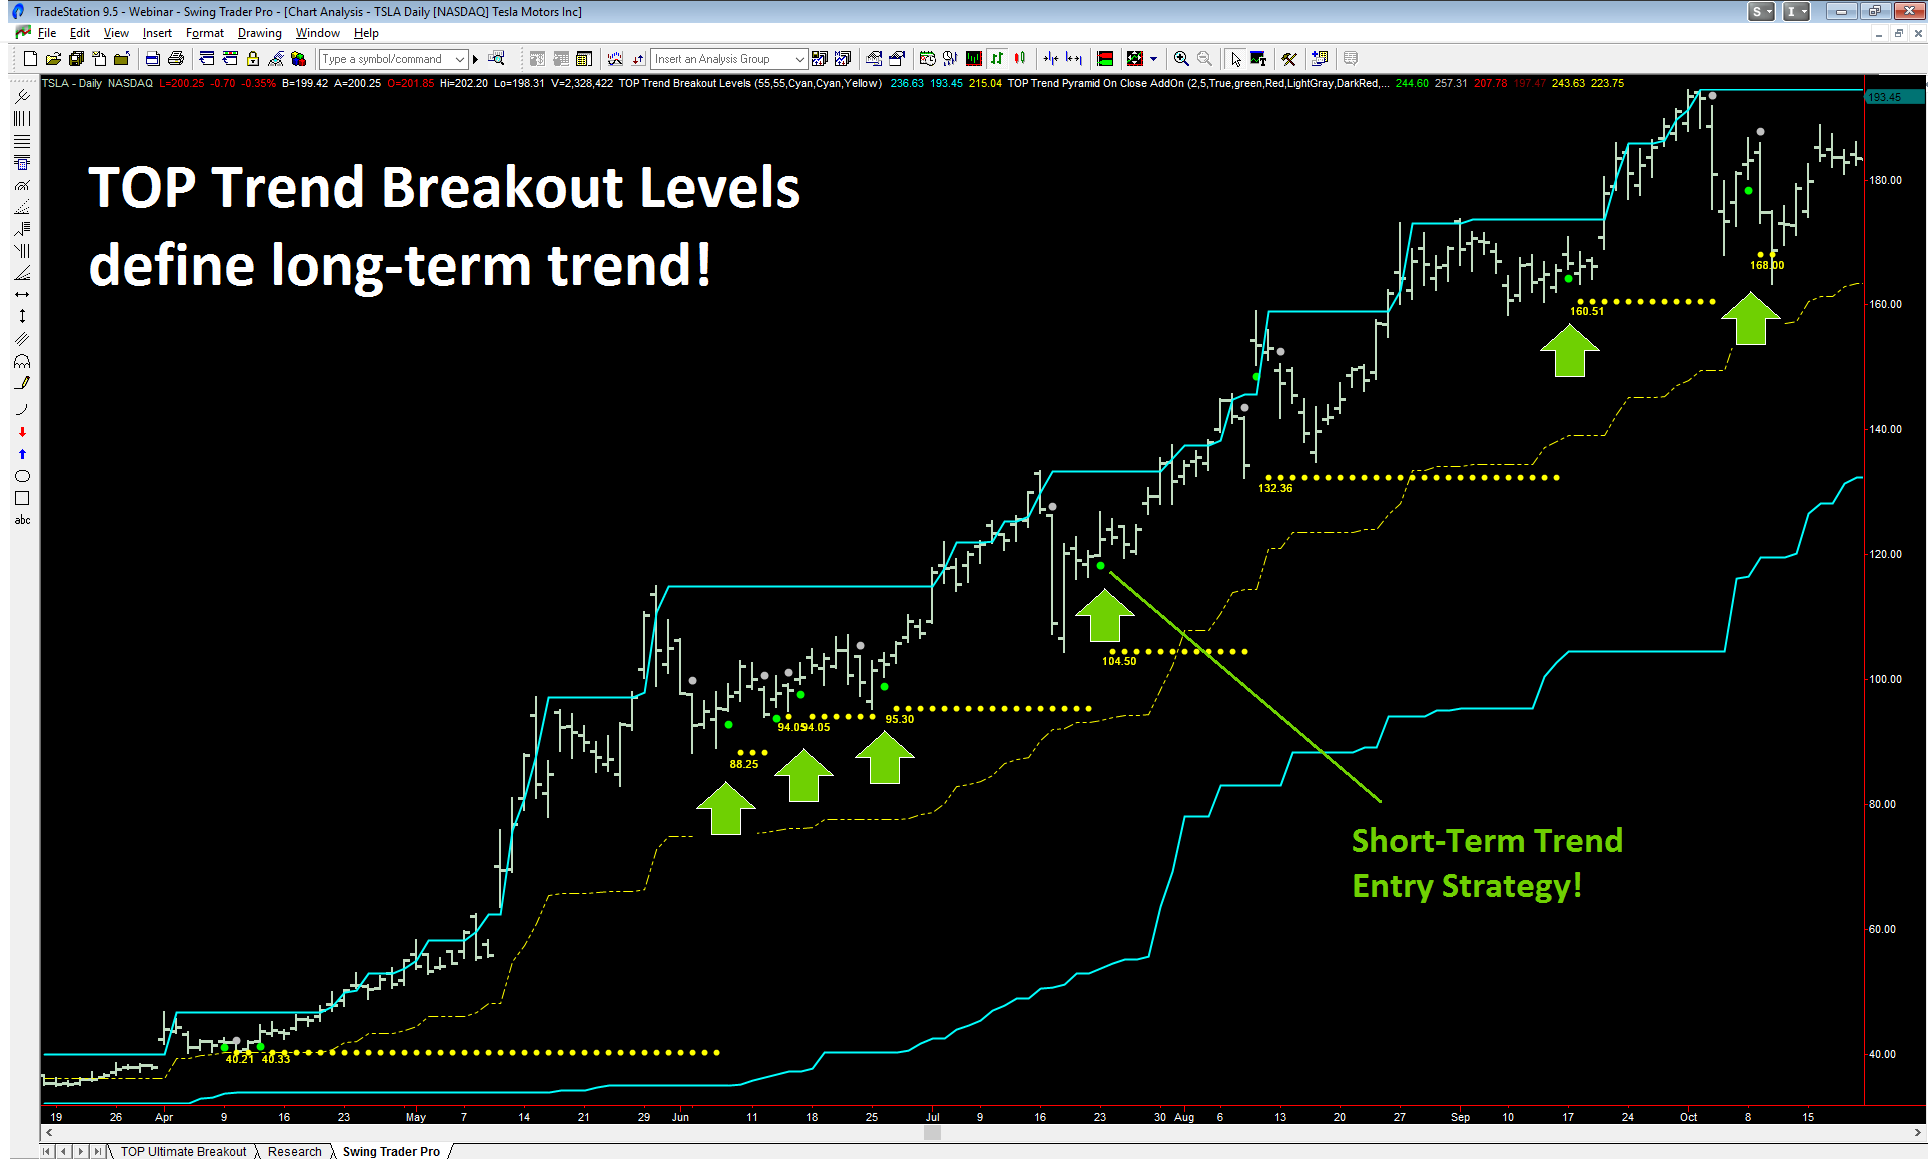
In the daily TSLA chart above, the TOP Trend Breakout Levels identified the long-term trend and a short-term buy entry pyramid strategy generated trade signals that could be used to enter into the longer-term trend in TSLA. This strategy, along with many others, represents creative ways to trade long-term trends!
We recommend that traders invest time to learn about trends and learn about the strengths and limitations of breakout trend trading. With knowledge and experience, we believe that any trader can learn when to trade with the TOP Trend Breakout Levels for long-term trend trading.
Simple Indicator Settings
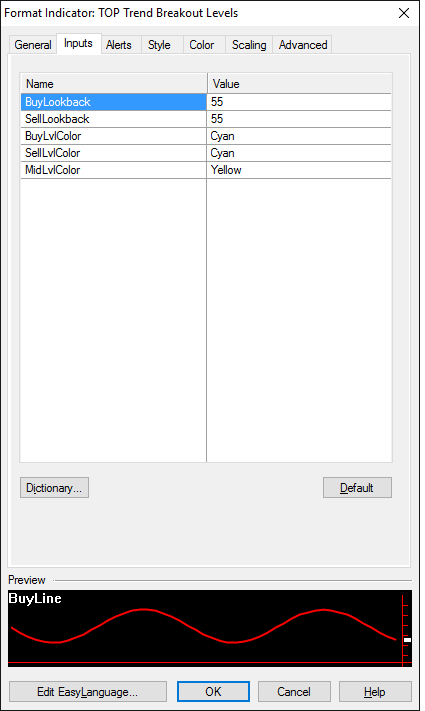
We have designed the TOP Trend Breakout Levels indicator to be both powerful and easy to use. Depending on the time focus of the trend you want to trade, the BuyLookBack and SellLookBack parameters can be increased in value to focus on longer-term trends or decreased in value to focus on shorter-term trends. The remaining parameters can be used to modify the colors of the breakout lines and the middle reference line.
IMPORTANT NOTICE! No representation is being made that the use of this strategy or any system or trading methodology will generate profits. Past performance is not necessarily indicative of future results. There is substantial risk of loss associated with trading securities and options on equities, futures, and FOREX markets. Only risk capital should be used to trade. Trading securities is not suitable for everyone. Disclaimer: Futures, Options, and Currency trading all have large potential rewards, but they also have large potential risk. You must be aware of the risks and be willing to accept them in order to invest in these markets. Don’t trade with money you can’t afford to lose. This website is neither a solicitation nor an offer to Buy/Sell futures, options, or currencies. No representation is being made that any account will or is likely to achieve profits or losses similar to those discussed on this web site. The past performance of any trading system or methodology is not necessarily indicative of future results. TopTradeTools.com, including any of its affiliates, will not be liable for any indirect, incidental, or consequential losses or damages which may include but are not limited to any kind of losses or lost profits that may result from either technology or material posted on this website or in our presentations.
CFTC RULE 4.41 – HYPOTHETICAL OR SIMULATED PERFORMANCE RESULTS HAVE CERTAIN LIMITATIONS. UNLIKE AN ACTUAL PERFORMANCE RECORD, SIMULATED RESULTS DO NOT REPRESENT ACTUAL TRADING. ALSO, SINCE THE TRADES HAVE NOT BEEN EXECUTED, THE RESULTS MAY HAVE UNDER-OR-OVER COMPENSATED FOR THE IMPACT, IF ANY, OF CERTAIN MARKET FACTORS, SUCH AS LACK OF LIQUIDITY. SIMULATED TRADING PROGRAMS IN GENERAL ARE ALSO SUBJECT TO THE FACT THAT THEY ARE DESIGNED WITH THE BENEFIT OF HINDSIGHT. NO REPRESENTATION IS BEING MADE THAT ANY ACCOUNT WILL OR IS LIKELY TO ACHIEVE PROFIT OR LOSSES SIMILAR TO THOSE SHOWN.
