TOP Momentum Bundle
with Quick Signal Trigger and Dual Color Histogram
The TOP Momentum indicator is one of our core trading tools that has been designed to provide professional traders with the clearest picture of market momentum for any market and timeframe.
Designed for Stocks, Bonds, Commodities, Futures, FOREX, and Options trading. TOP Momentum is a powerful tool that can be used for Day Trading, Swing Trading, and for strategic entry Trend Trading! Effective on both intraday and end-of-day charts including 5 minute charts, 60 minute charts, daily charts, weekly charts, and tick charts to name a few.
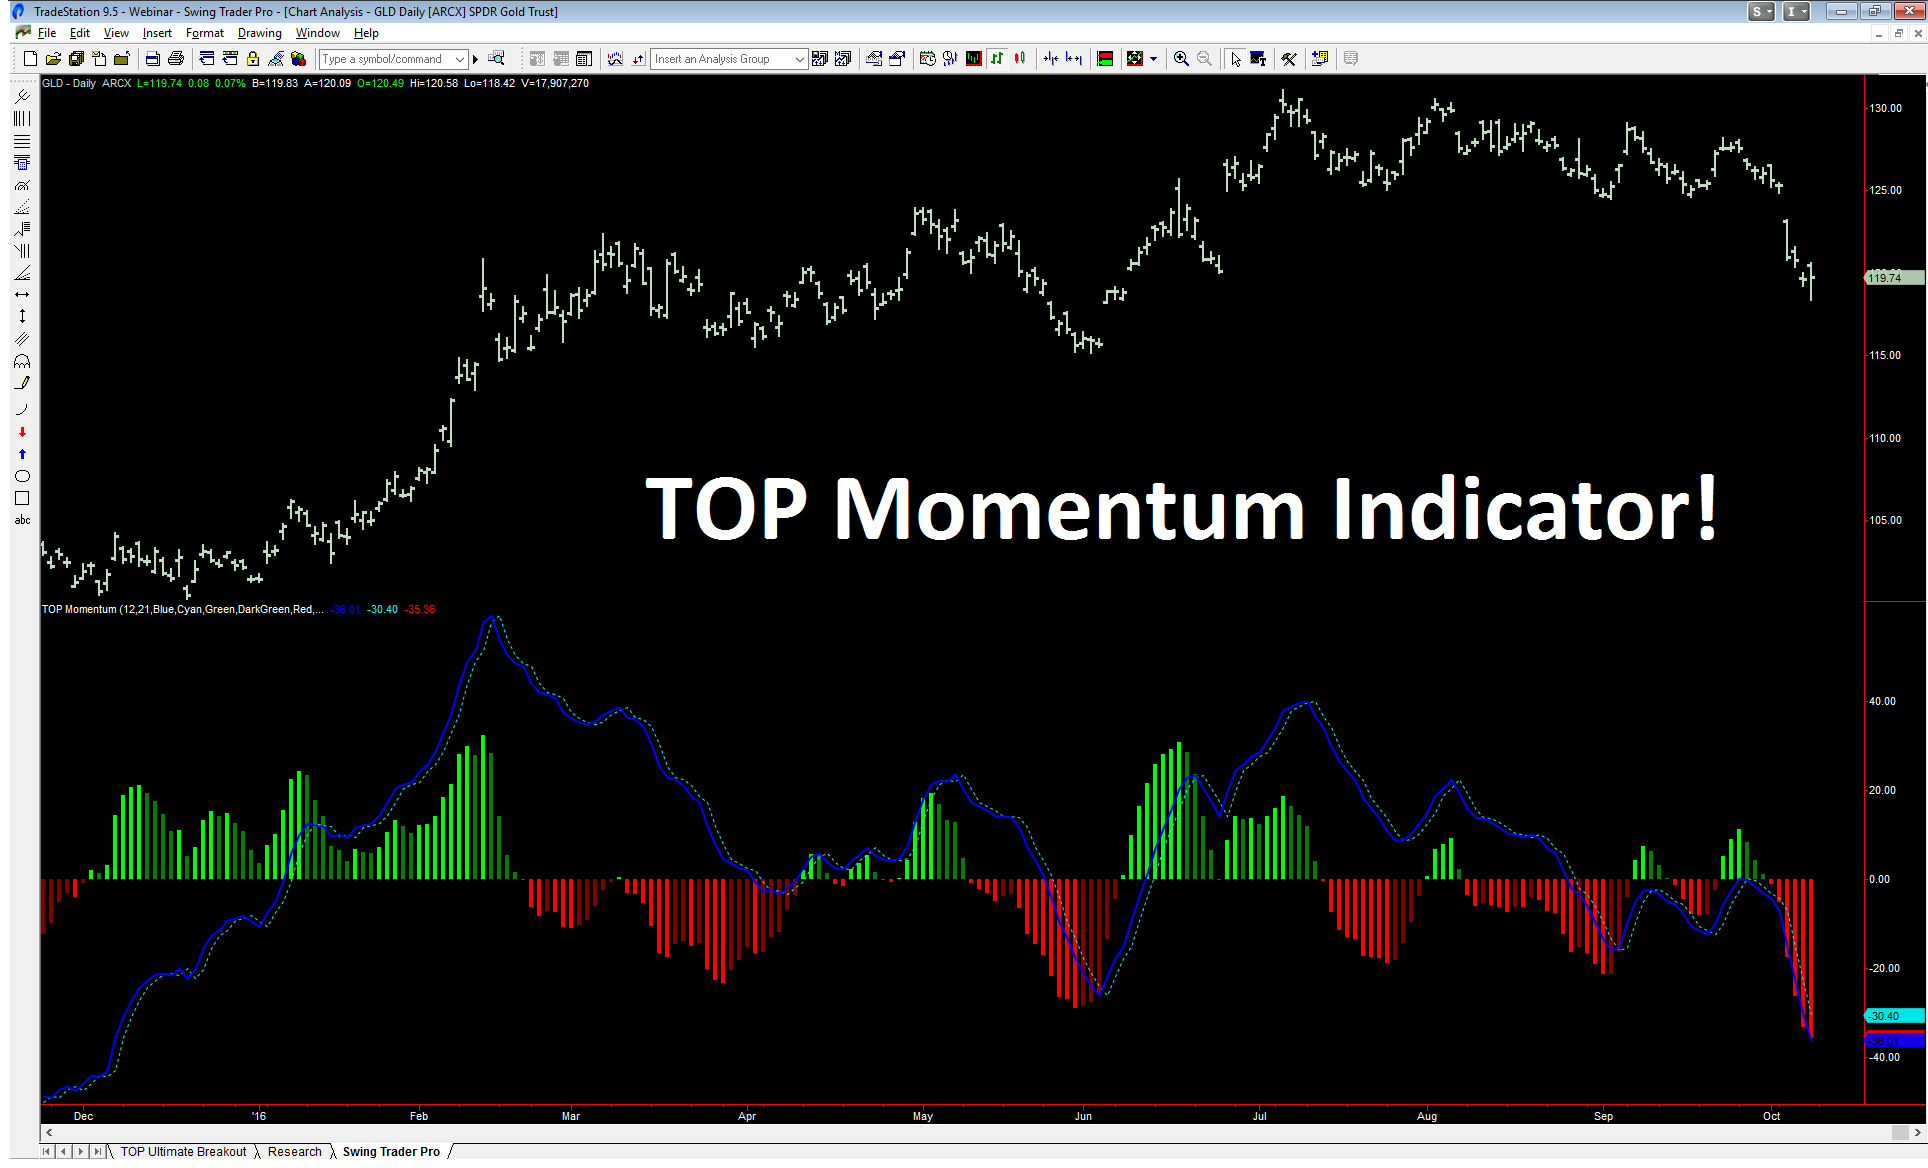
Most professional traders agree that a clear momentum picture of any market can be a powerful predictor of future price moves. Market momentum communicates the raw power of buyers and sells and the force that they are willing to exert on a market. Subtle changes in momentum can provide powerful clues that a market is about to accelerate or even reverse. The TOP Momentum indicator has been designed to give professional traders several powerful advantages over traditional momentum indicators.
Quick Trigger Technology
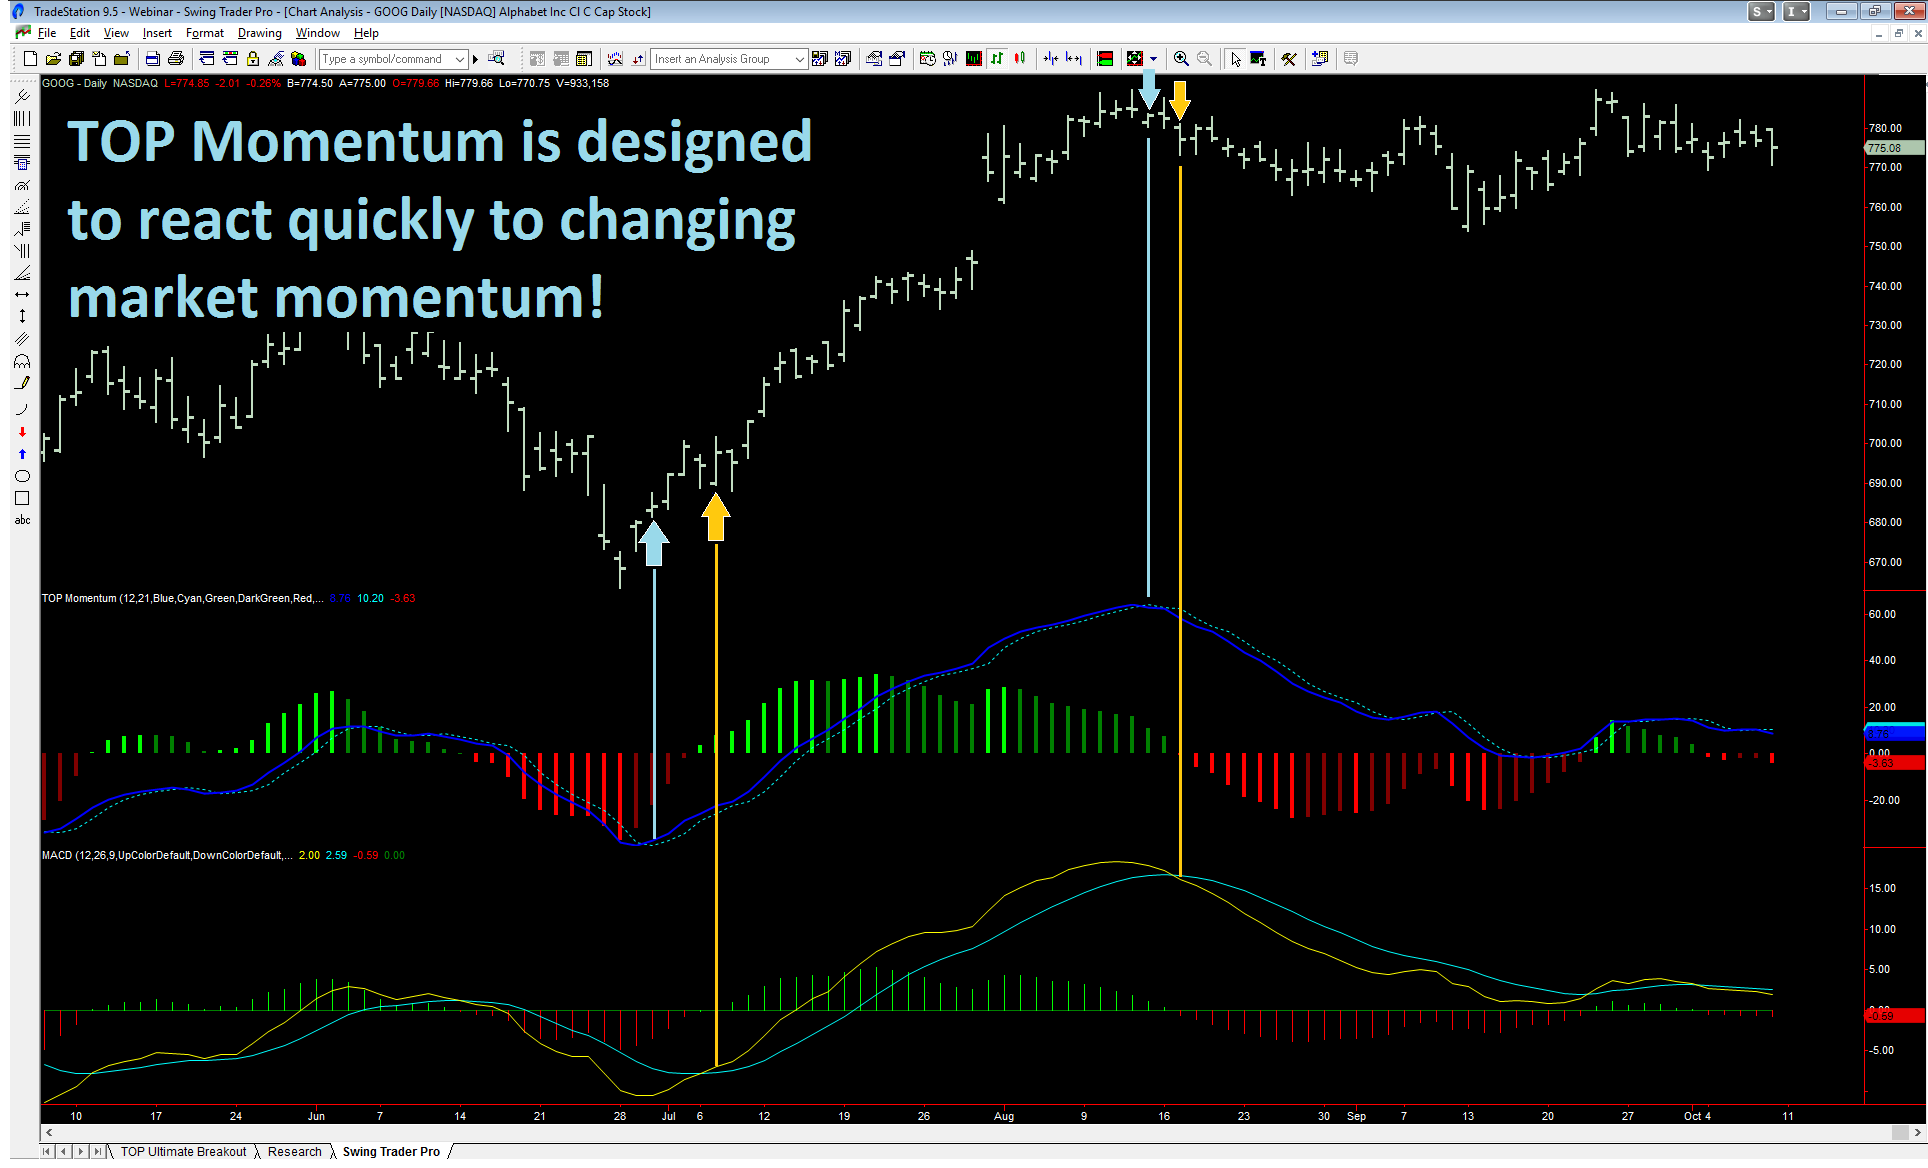
When market momentum turns or accelerates, it pays to have a reactive tool that can quickly detect market momentum changes. See in the chart below how the TOP Momentum indicator can generate a faster momentum shift trigger when compared to conventional momentum indicators like the MACD.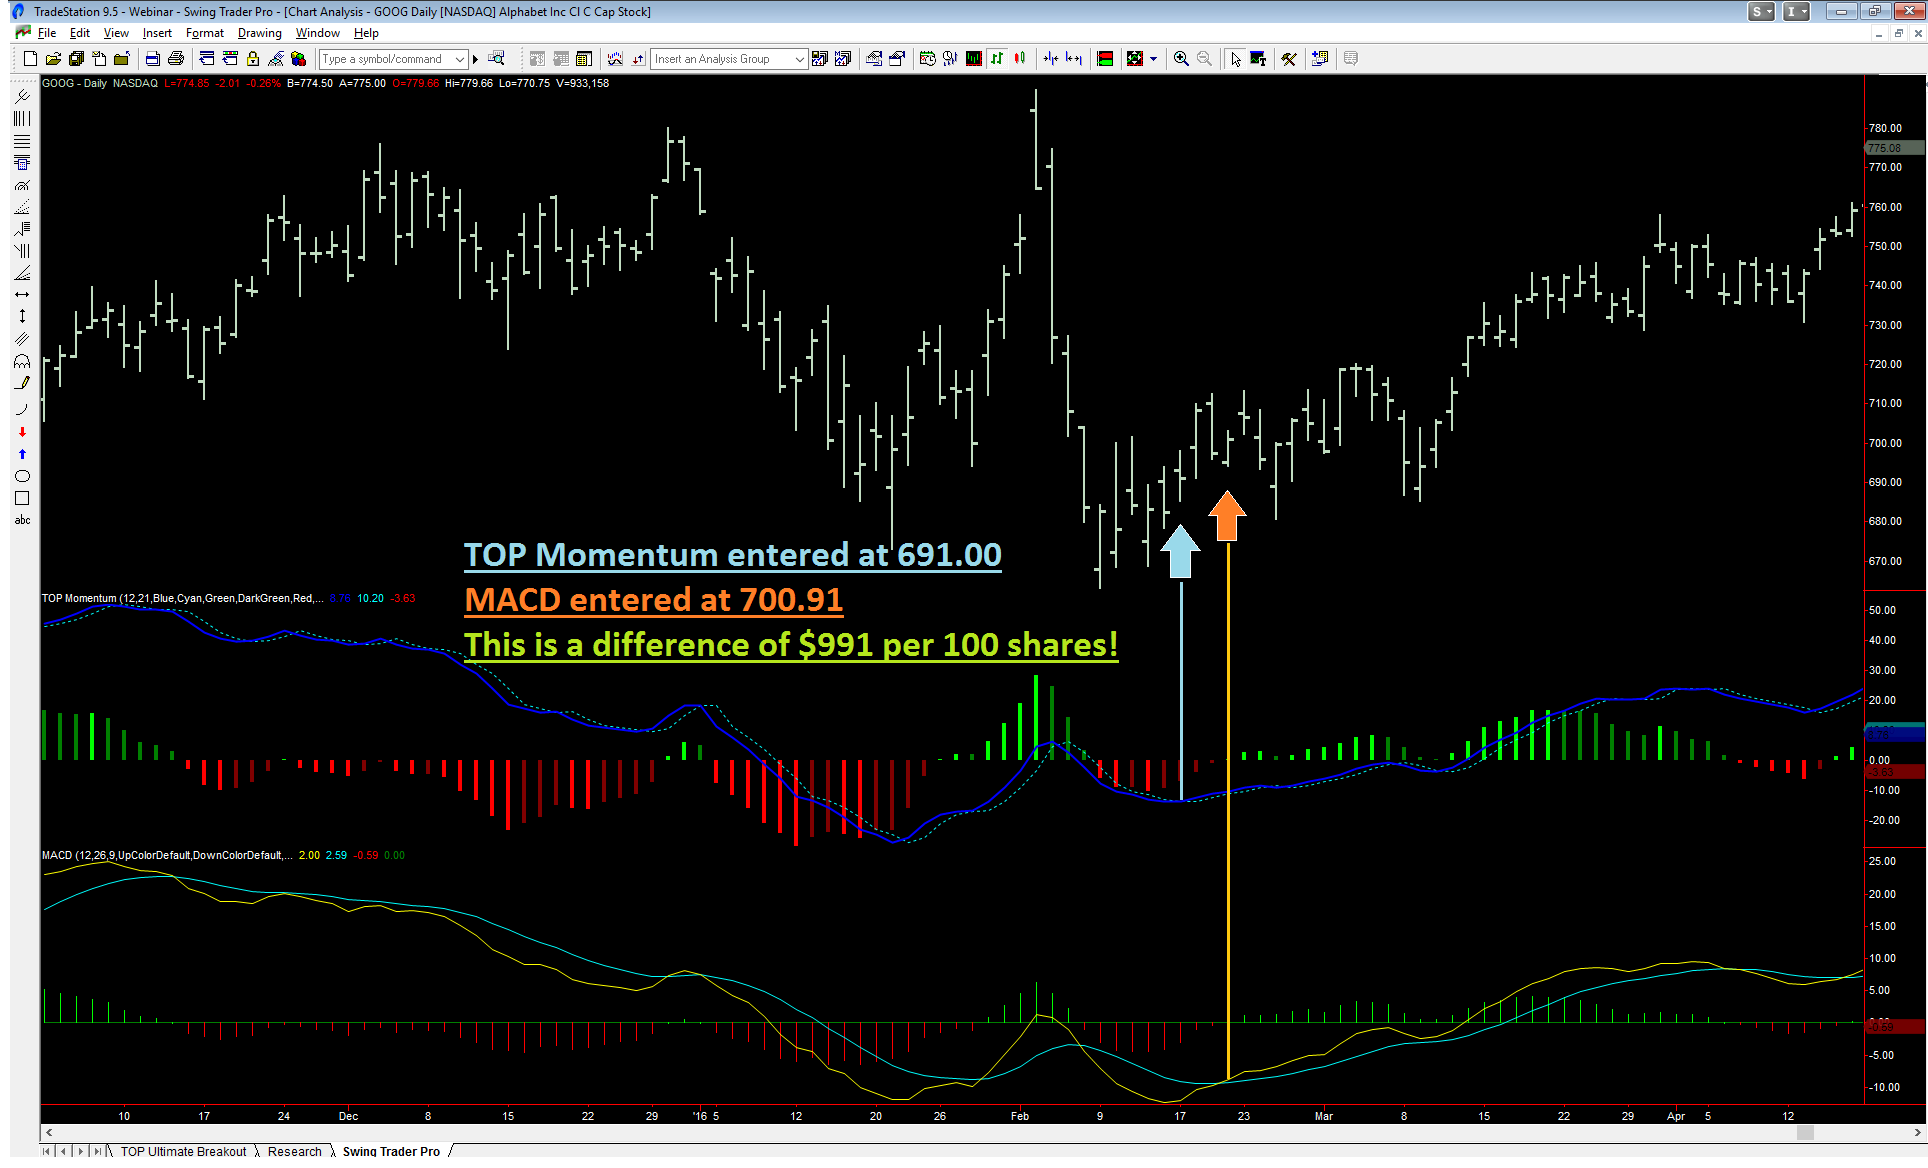
In the Google example above, you can clearly see how the TOP Momentum indicator line crossed the signal line much more quickly when compared to the MACD. In the example above, this would have made a difference of approximate $991 on 100 shares on this single entry! The example below is even more striking…
Risk Disclaimer: There is a risk of loss in trading and past performance is not necessarily indicative of future results.
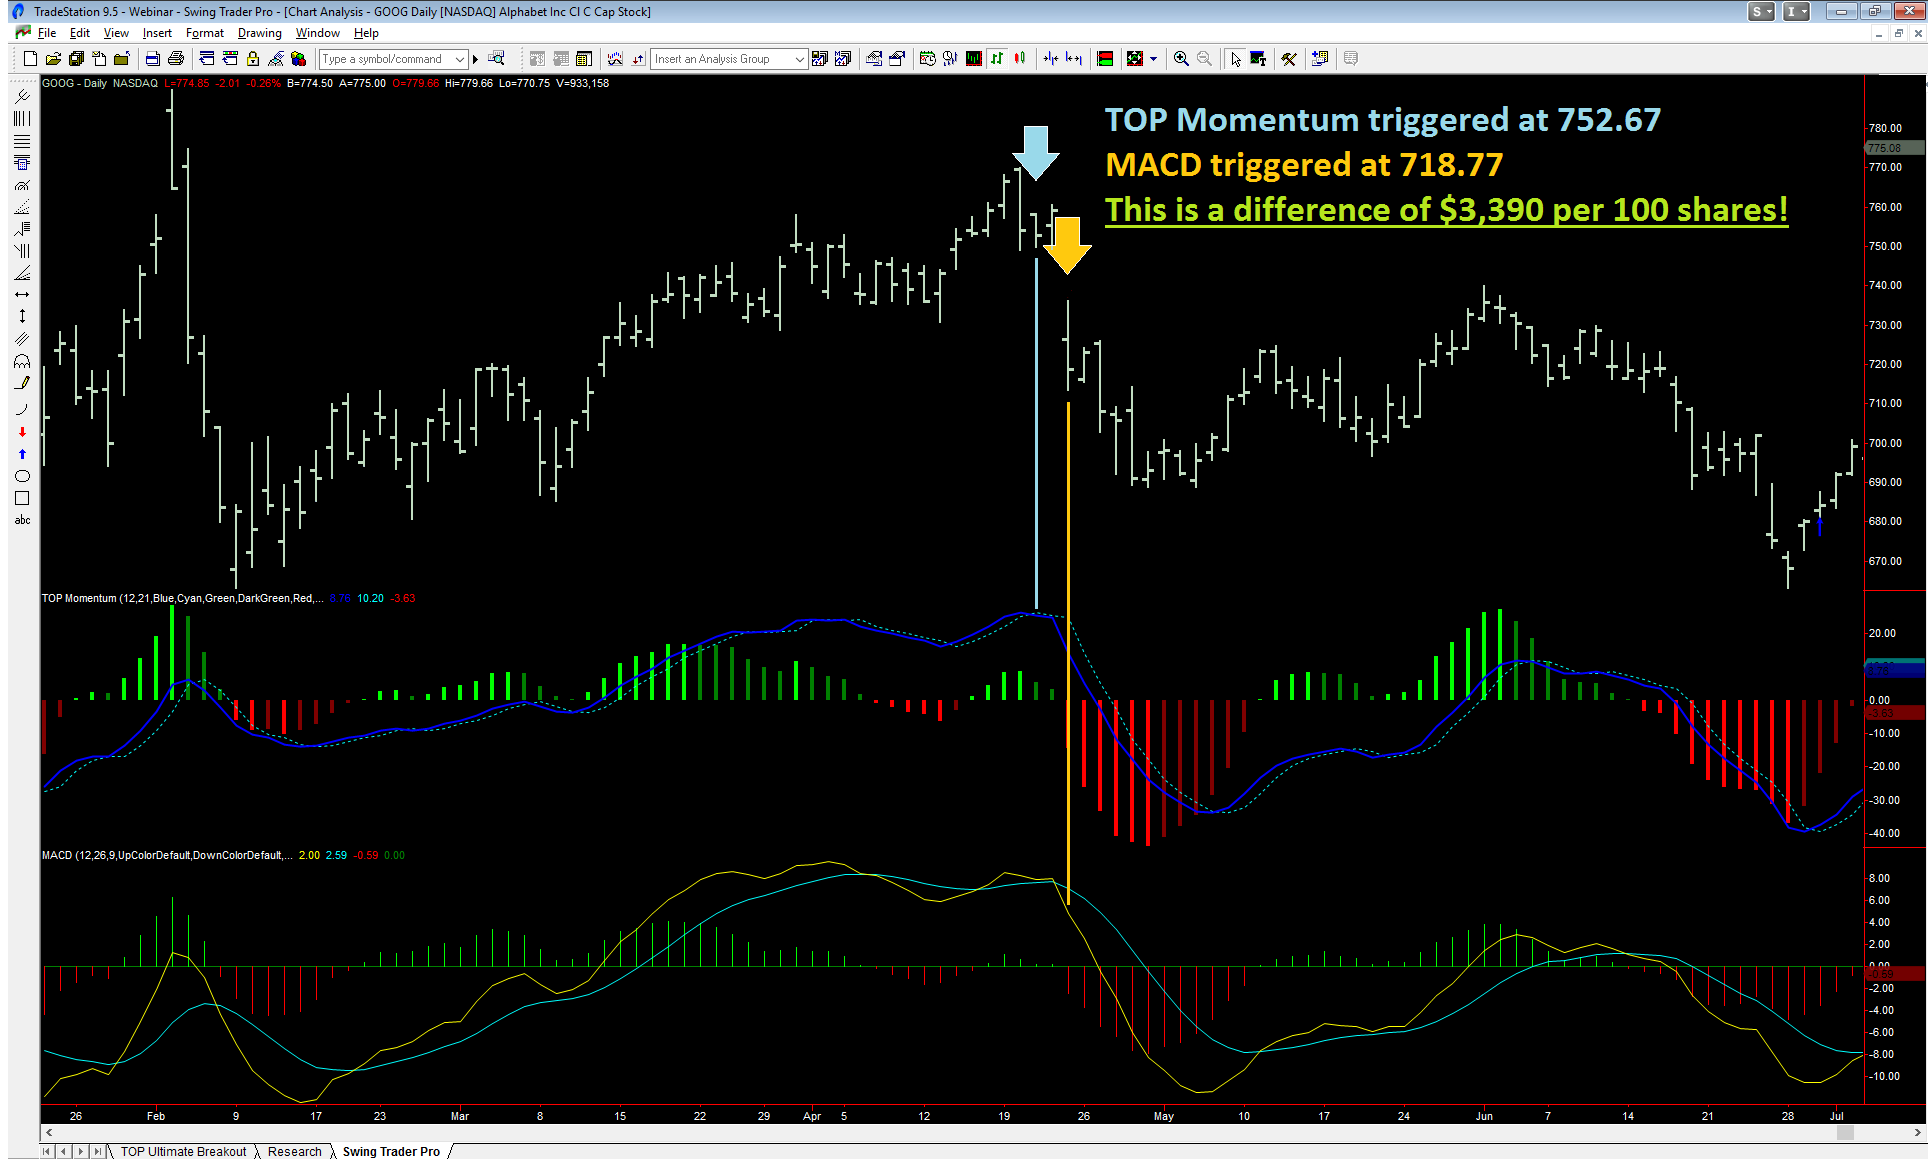
When market momentum changes quickly, you need to be able to react quickly. Your ability to react quickly to changing market momentum may be the difference between achieving profits or experiencing losses! In the Google chart above, you can clearly see that MACD did not trigger a signal until after Google had fallen almost $40 per share further than the trigger point identified by TOP Momentum!
Dual Color Histogram
The TOP Momentum dual colored histogram is designed to communicate when momentum is strengthening or weakening. So whether you want to trade stocks, gold, forex, or bonds, the TOP Momentum indicator will be a powerful addition to your trading toolbox.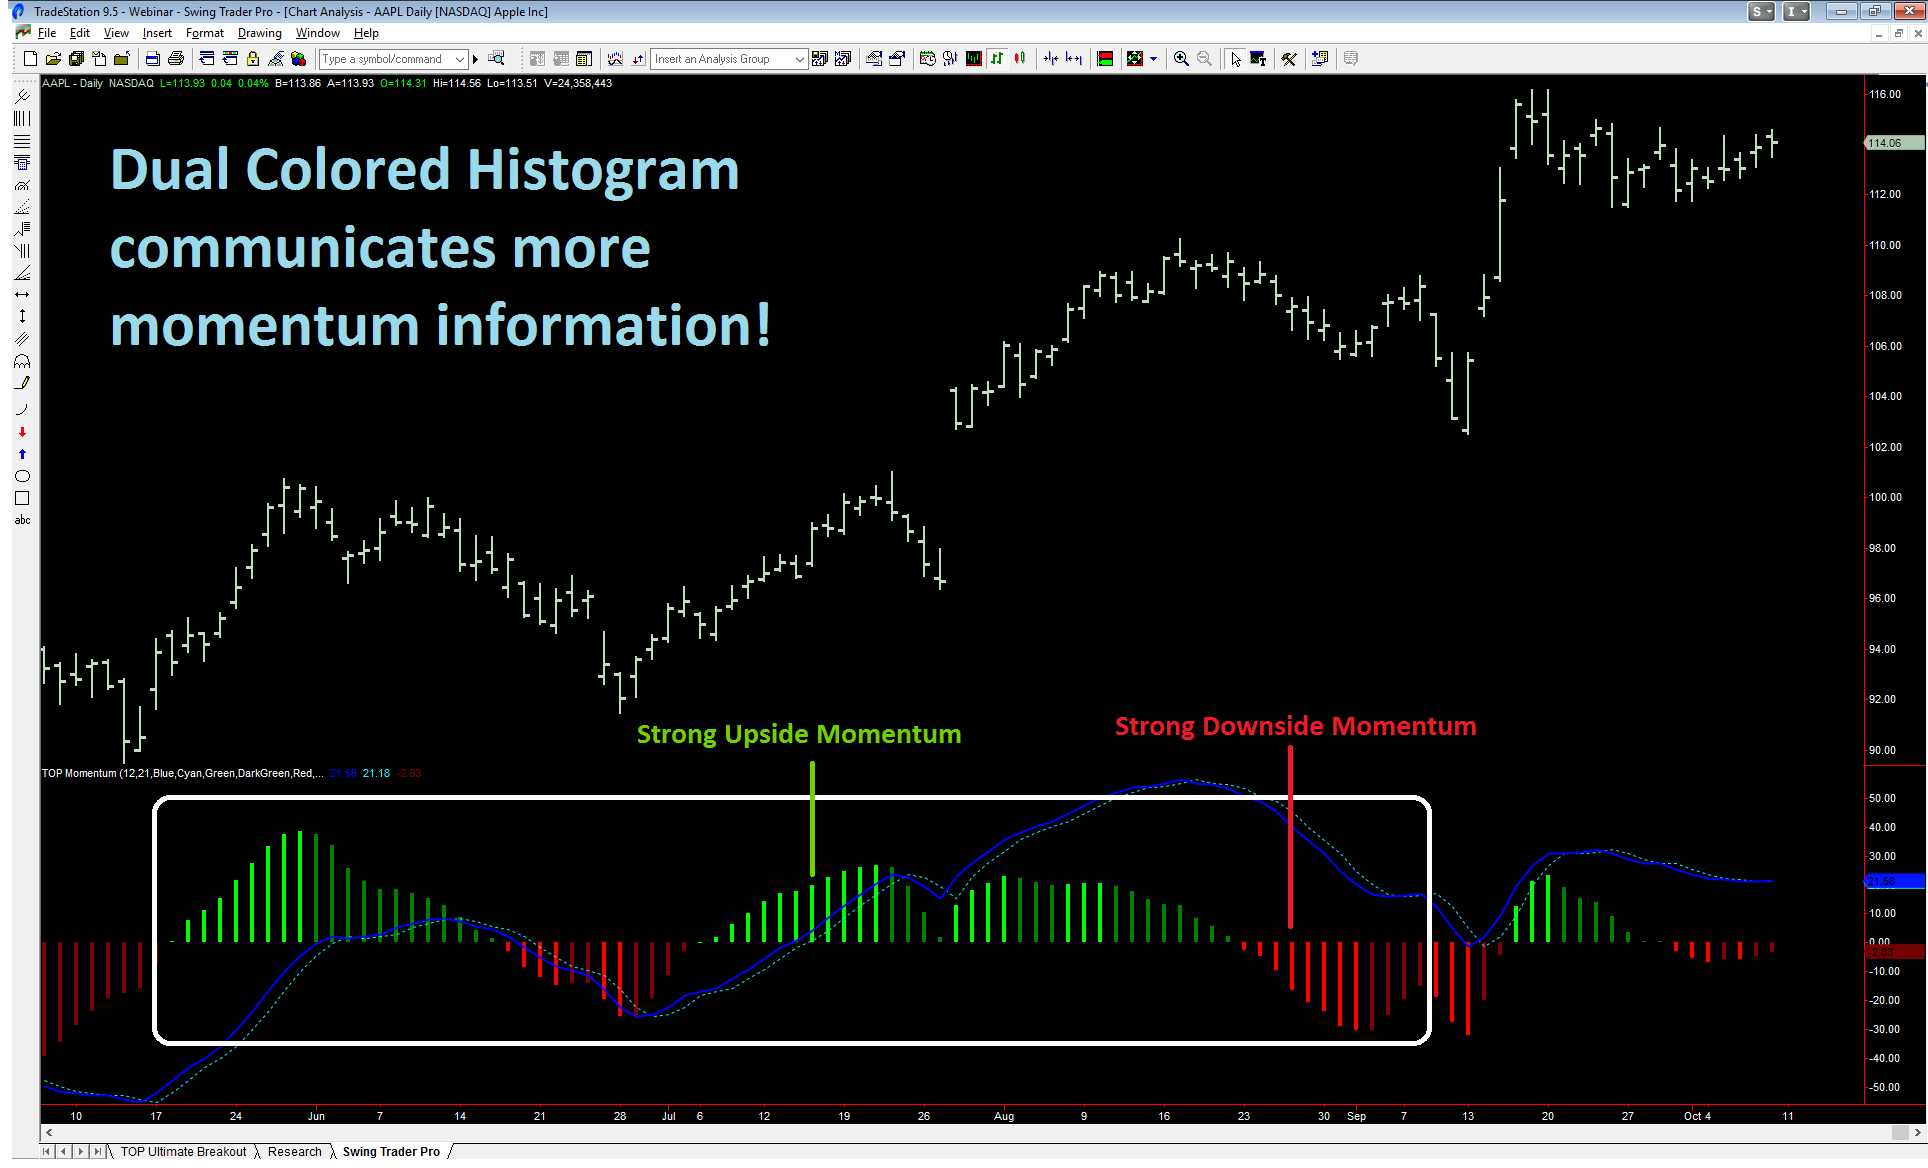
TOP Momentum comes with a built in multi-colored histogram designed to communicate more momentum information to you. Bright Green histogram bars communicate strong upside momentum while Dark Green bars communicate weakening upside momentum. On the flip side, Bright Red bars communicate strong downside momentum while Dark Red bars communicate weakening downside momentum.
Find Momentum Based Setups
Professional traders will tell you that high probability trade setups can dramatically increase your odds for making money in the markets. There are a number of powerful momentum based trade setups that you can identify using the TOP Momentum indicator.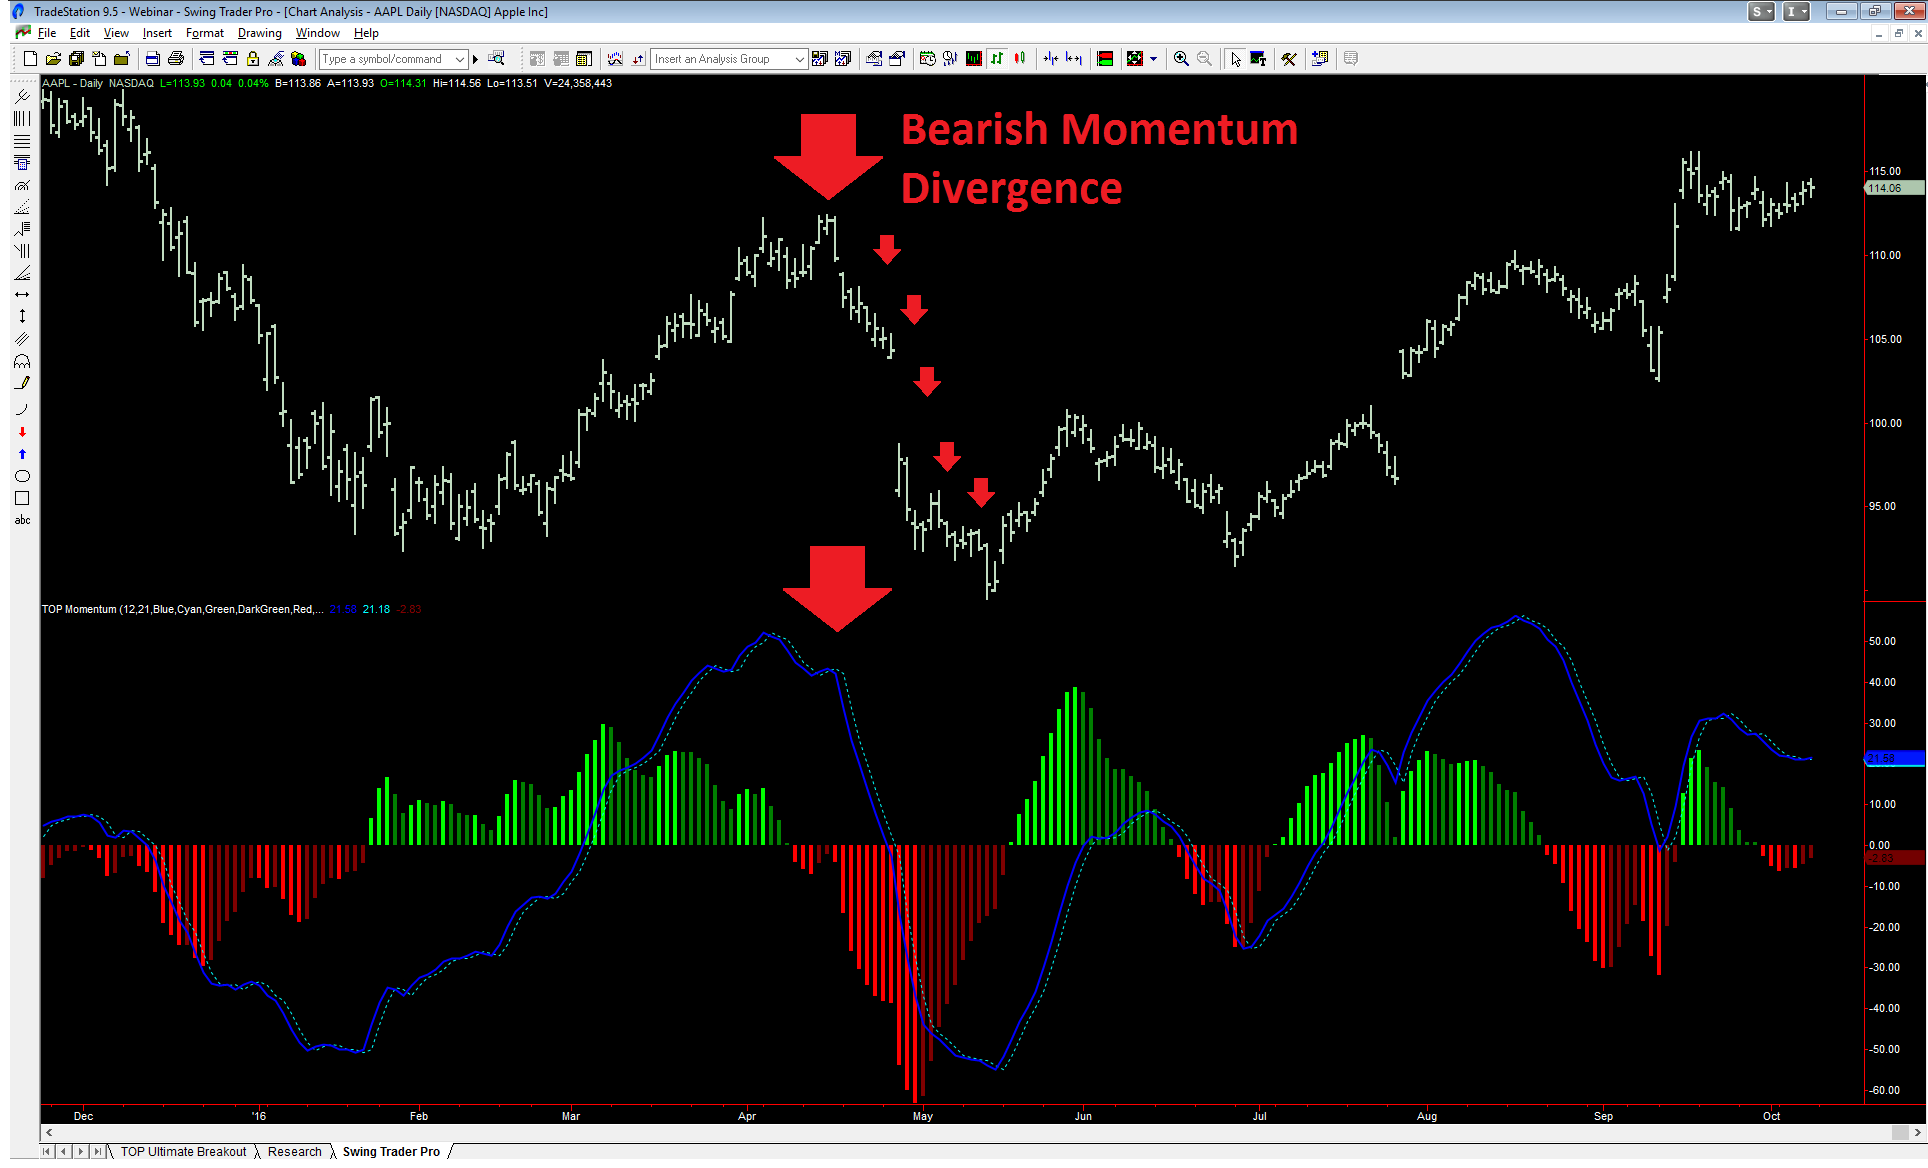
The Bearish Momentum Divergence identified in the Apple price chart above using the TOP Momentum indicator accurately forecasted a sharp drop in Apple prices. As you increase your skill level, this trade setup, along with many others, can be identified in the markets with the TOP Momentum indicator.
Simple Indicator Parameters
We have designed the TOP Momentum indicator to be both powerful and easy to use. Our default settings represent our recommended settings. However, if you wish, you can adjust the TOP Momentum indicator settings to focus on longer-term or shorter-term market momentum by modifying the MomLength and SmoothLength parameters. You can also modify the colors of the indicator lines and the histogram color to your preferences.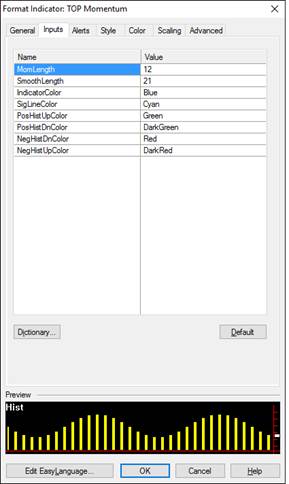
Get the TOP Momentum Advantage Today!
Both new traders and professional traders alike can benefit from the power of the TOP Momentum indicator for day trading, swing trading, and trend trading. The TOP Momentum indicator can be used to trade Stocks, Bonds, ETFs, Options, Futures, FOREX, and CFDs. Now you can learn to find high probability trade setups with the TOP Momentum indicator as your skill level increases. Not all momentum indicators are alike. Get the professional grade TOP Momentum advantage today. Click the button below to begin enjoying the TOP Momentum indicator today!The TOP Momentum Bars color bars indicator is designed to color price bars to give the clearest picture of market momentum for any timeframe.
Designed for Stocks, Bonds, Commodities, Futures, FOREX, and Options trading. TOP Momentum Bars is a powerful tool that can be used for Day Trading, Swing Trading, and for strategic entry Trend Trading! Effective on both intraday and end-of-day charts including 5 minute charts, 60 minute charts, daily charts, weekly charts, and tick charts to name a few.
Most professional traders agree that a clear momentum picture of any market can be a powerful predictor of future price moves. Market momentum communicates the raw power of buyers and sells and the force that they are willing to exert on a market. Subtle changes in momentum can provide powerful clues that a market is about to accelerate or even reverse. The TOP Momentum Bars indicator has been designed to give professional traders several powerful advantages over traditional momentum indicators.
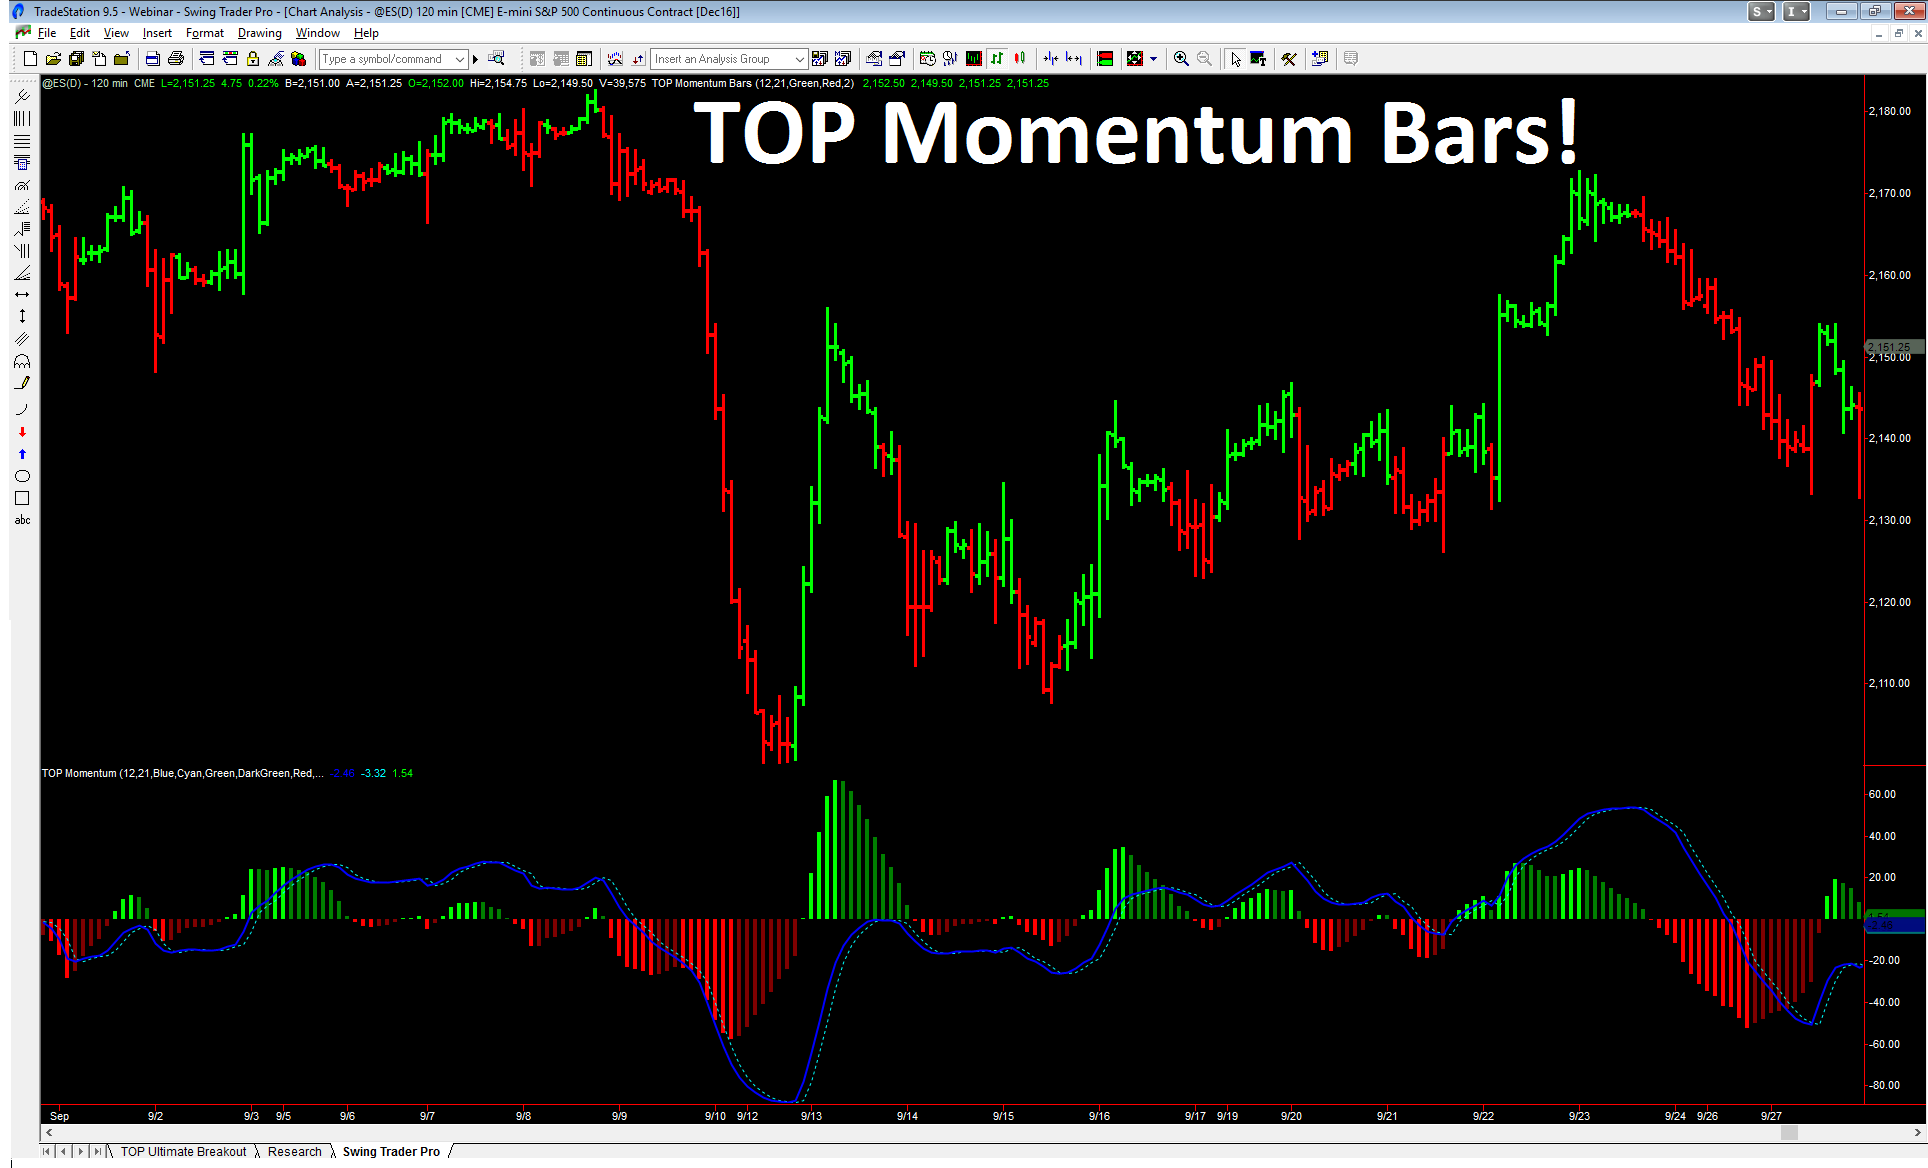
Quick Trigger Technology
When market momentum turns or accelerates, it pays to have a professional grade tool that can quickly detect market momentum changes. See in the chart below how the TOP Momentum Bars indicator can generate timely colored bars to detect quick changes in market momentum.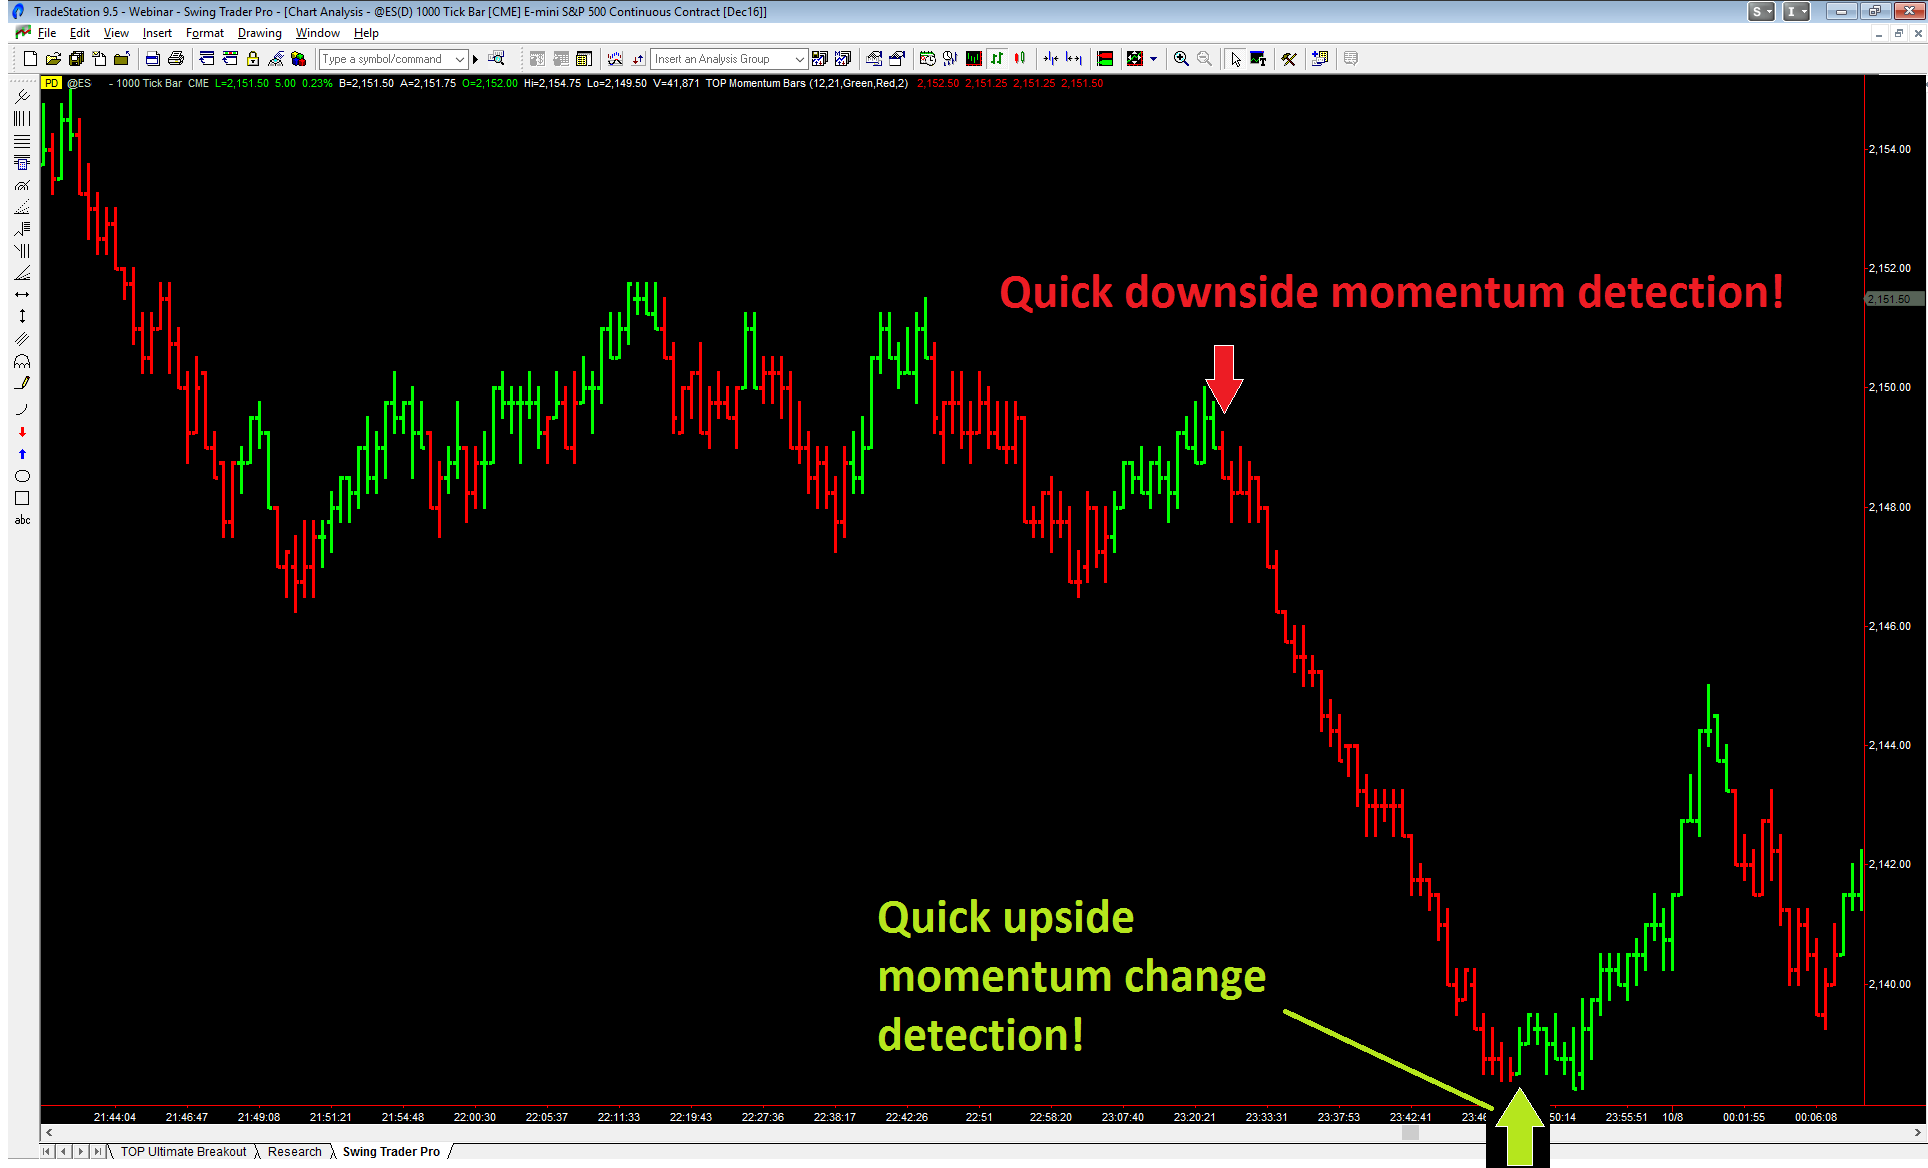
In the S&P 500 futures example above, you can clearly see how the TOP Momentum Bars indicator was quick to react when market momentum and direction changed. In today’s fast paced markets, reaction speed to changing market conditions can make the difference between making profits and realizing losses.
Risk Disclaimer: There is a risk of loss in trading and past performance is not necessarily indicative of future results.
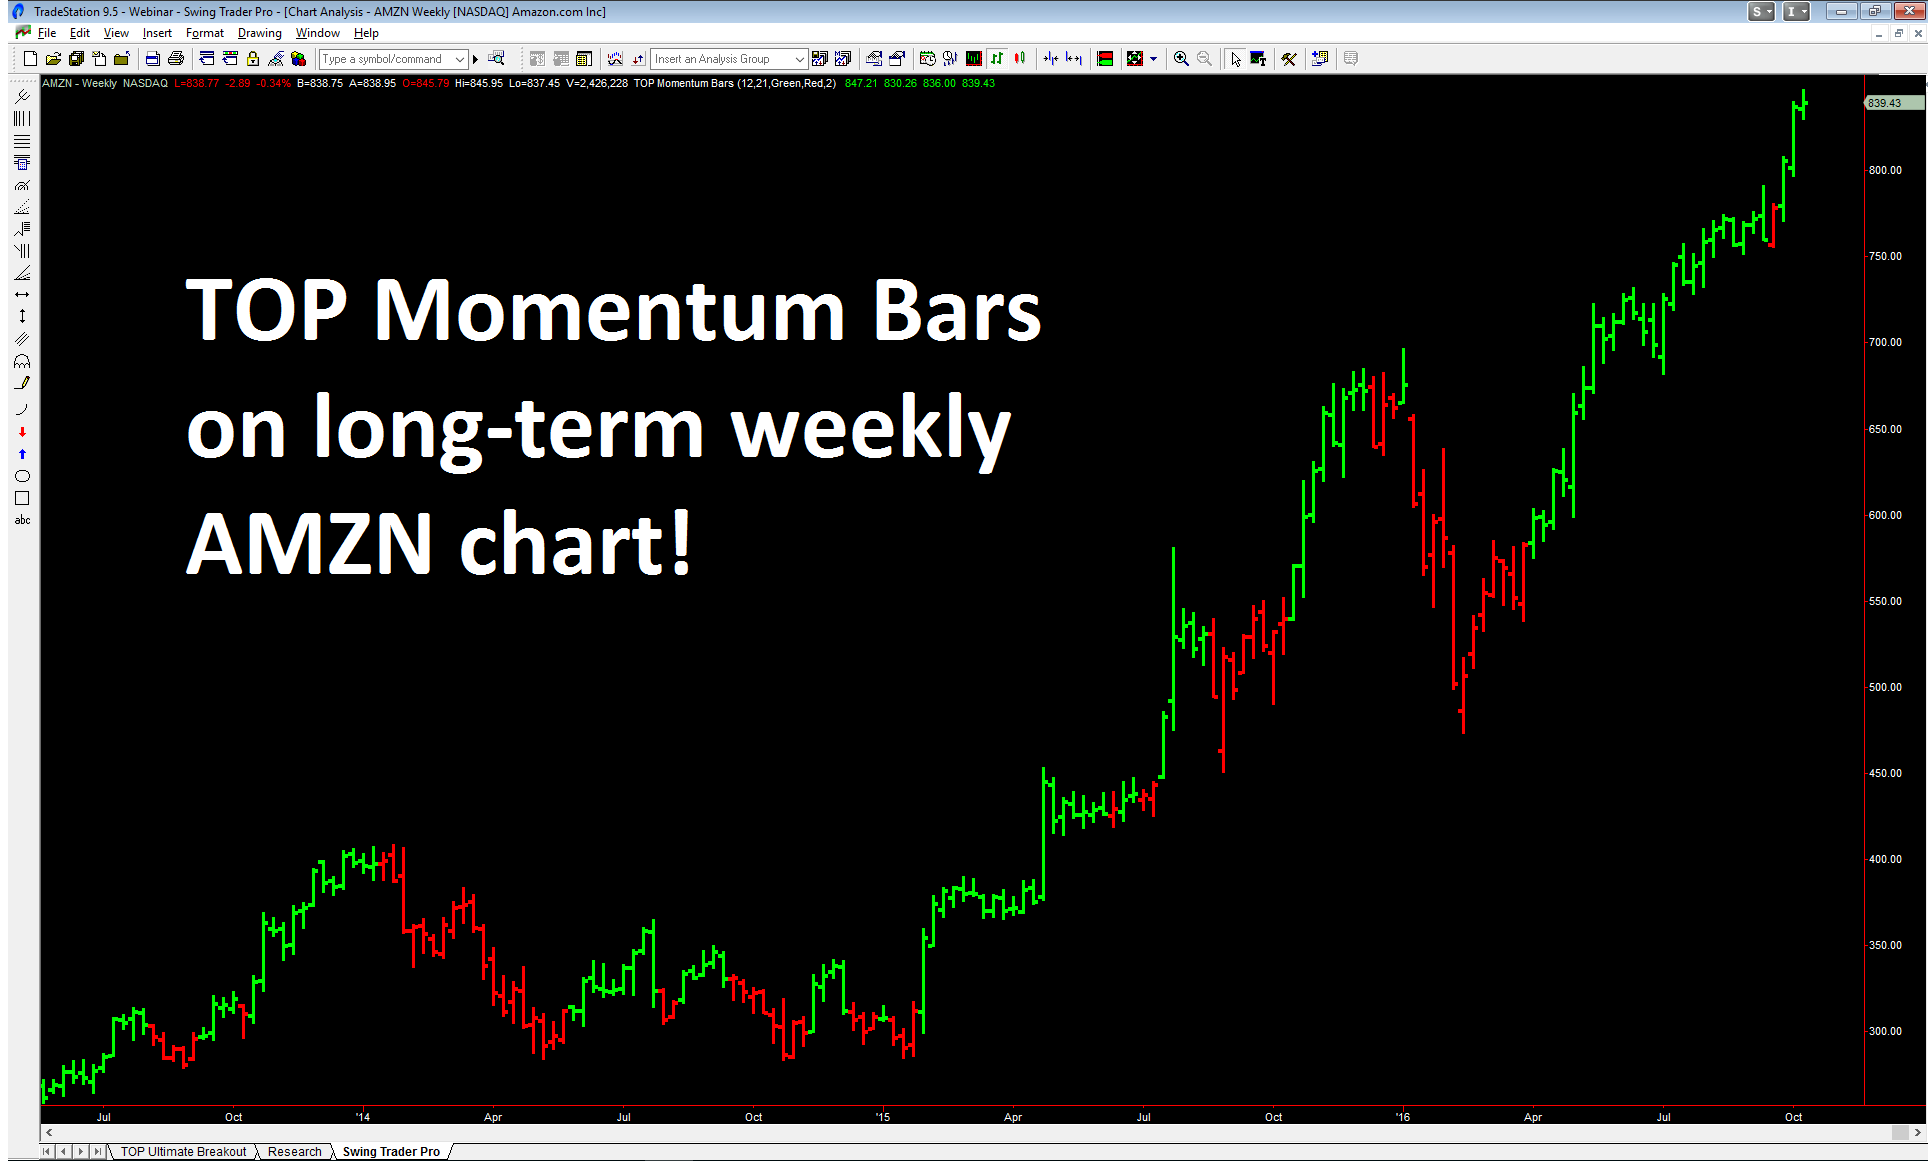
When market momentum changes, you need to be able to react. Many professional traders track long-term market momentum to determine the direction of the underlying trend. As you can see in the AMZN chart above, long-term momentum patterns are worth monitoring.
Find Momentum Based Setups
Professional traders will tell you that high probability trade setups can dramatically increase your odds for making money in the markets. There are a number of powerful momentum based trade setups that you can identify using the TOP Momentum Bars indicator combined with other indicators.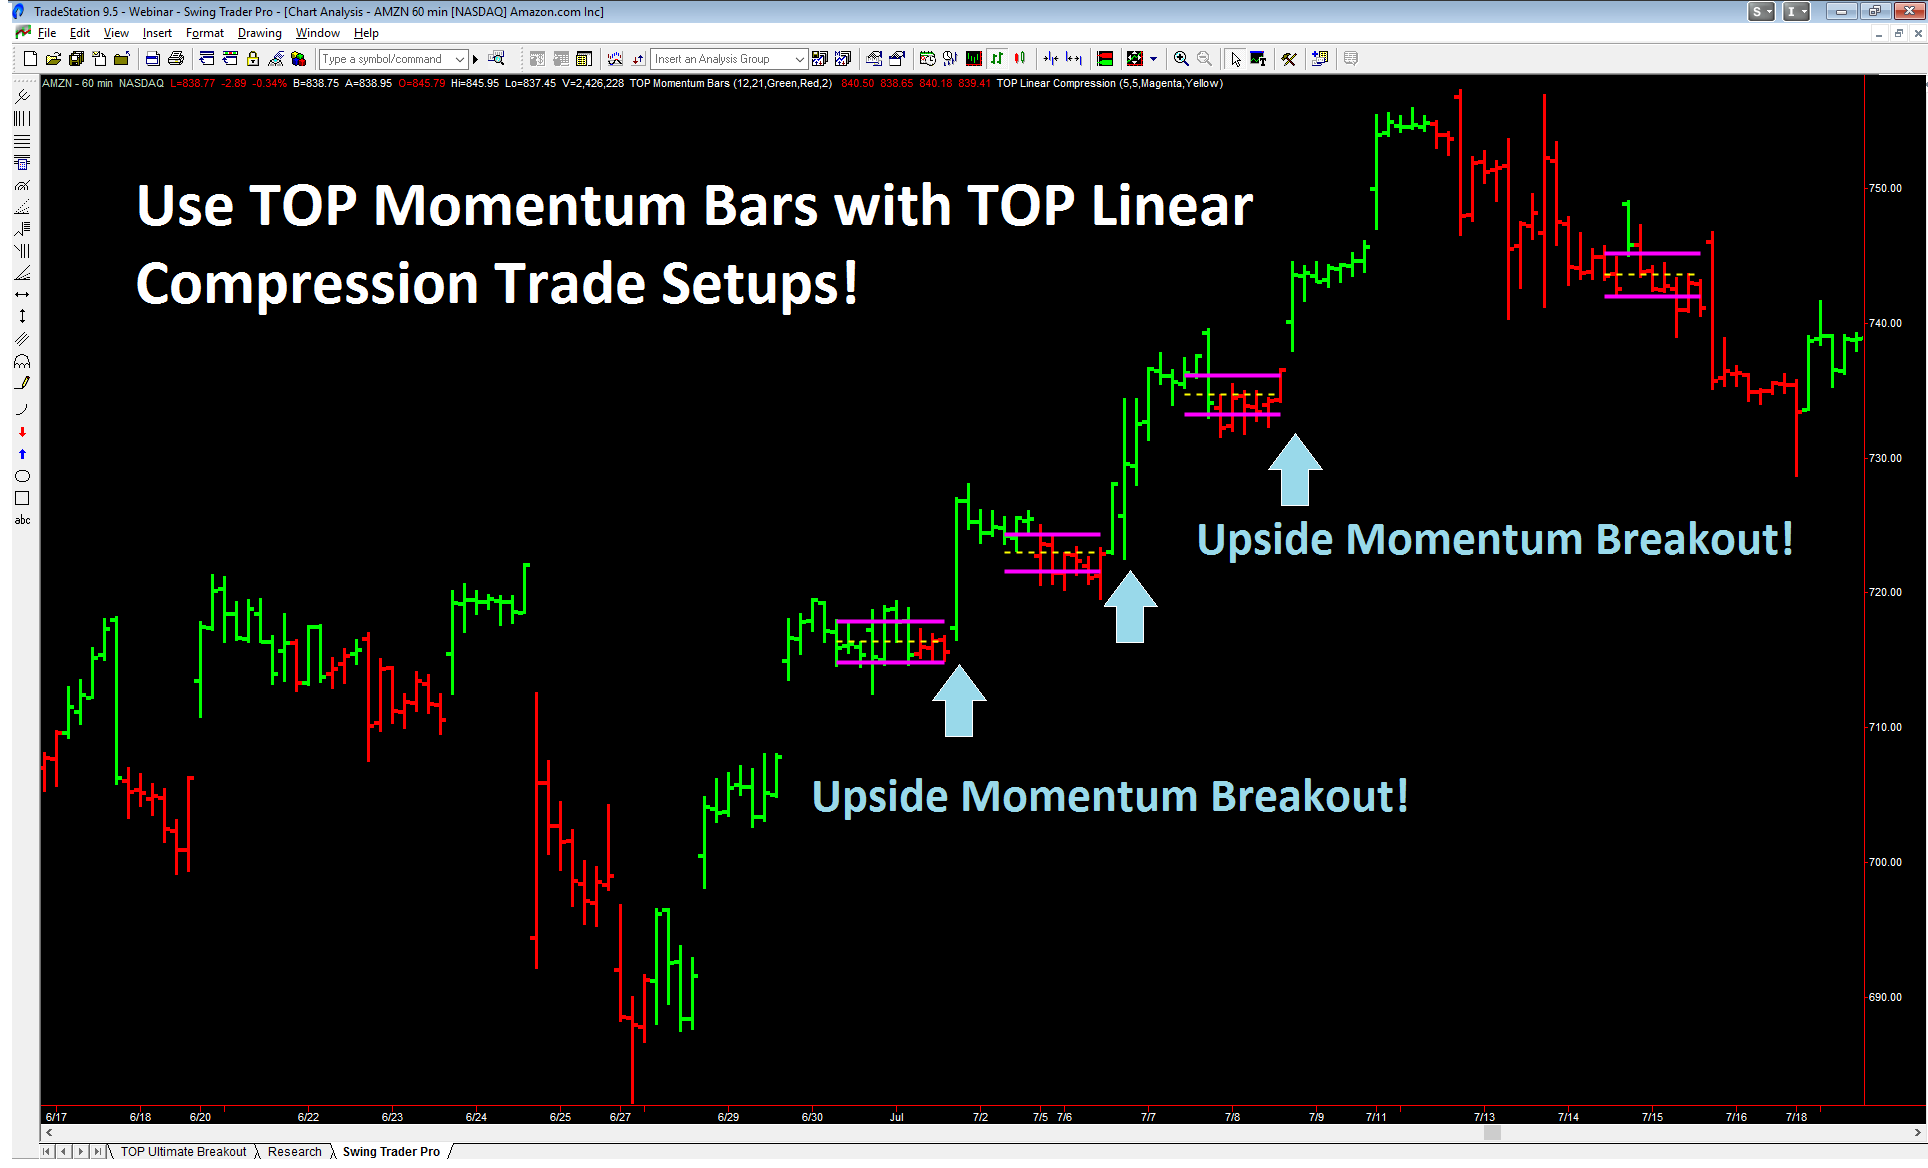
The linear compression setups identified by the TOP Linear Compression indicator in the AMZN chart above can be combined with TOP Momentum Bars to create a powerful one-two punch strategy! TOP Momentum Bars are a great tool to confirm the direction of prices after trade setups are identified.
Simple Indicator Parameters
We have designed the TOP Momentum Bars indicator to be both powerful and easy to use. Our default settings represent our recommended settings. However, if you wish, you can adjust the TOP Momentum Bars indicator settings to focus on longer-term or shorter-term market momentum by modifying the MomLength and SmoothLength parameters. You can also modify the bar colors and the bar thickness.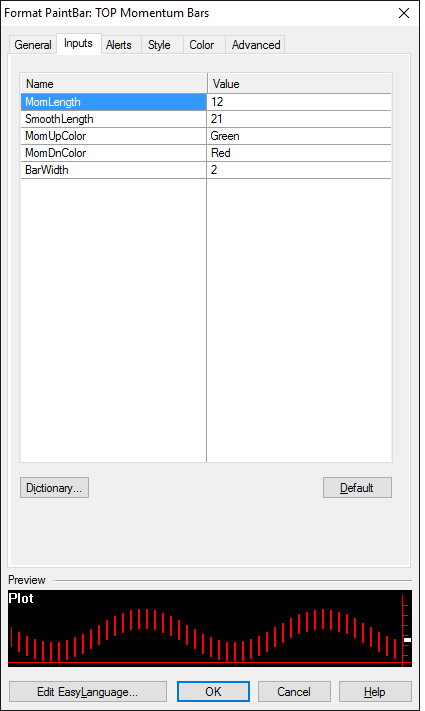
Get the TOP Momentum Bars Advantage Today!
Both new traders and professional traders alike can benefit from the power of the TOP Momentum Bars indicator for day trading, swing trading, and trend trading. The TOP Momentum Bars indicator can be used to trade Stocks, Bonds, ETFs, Options, Futures, FOREX, and CFDs. Now you can learn to find high probability trade setups with the TOP Momentum Bars indicator as your skill level increases. Not all momentum indicators are alike. Get the professional grade TOP Momentum Bars advantage today by clicking the button below!TOP Momentum Flags with Quick Signal Trigger
The TOP Momentum Flags (ShowMe) is designed to display momentum direction dots next to price bars to give the clearest picture of market momentum for any market and timeframe. Designed for Stocks, Bonds, Commodities, Futures, FOREX, and Options trading. TOP Momentum Flags is a powerful tool that can be used for Day Trading, Swing Trading, and for strategic entry Trend Trading! Effective on both intraday and end-of-day price charts including 5 minute charts, 60 minute charts, daily charts, weekly charts, and tick charts to name a few.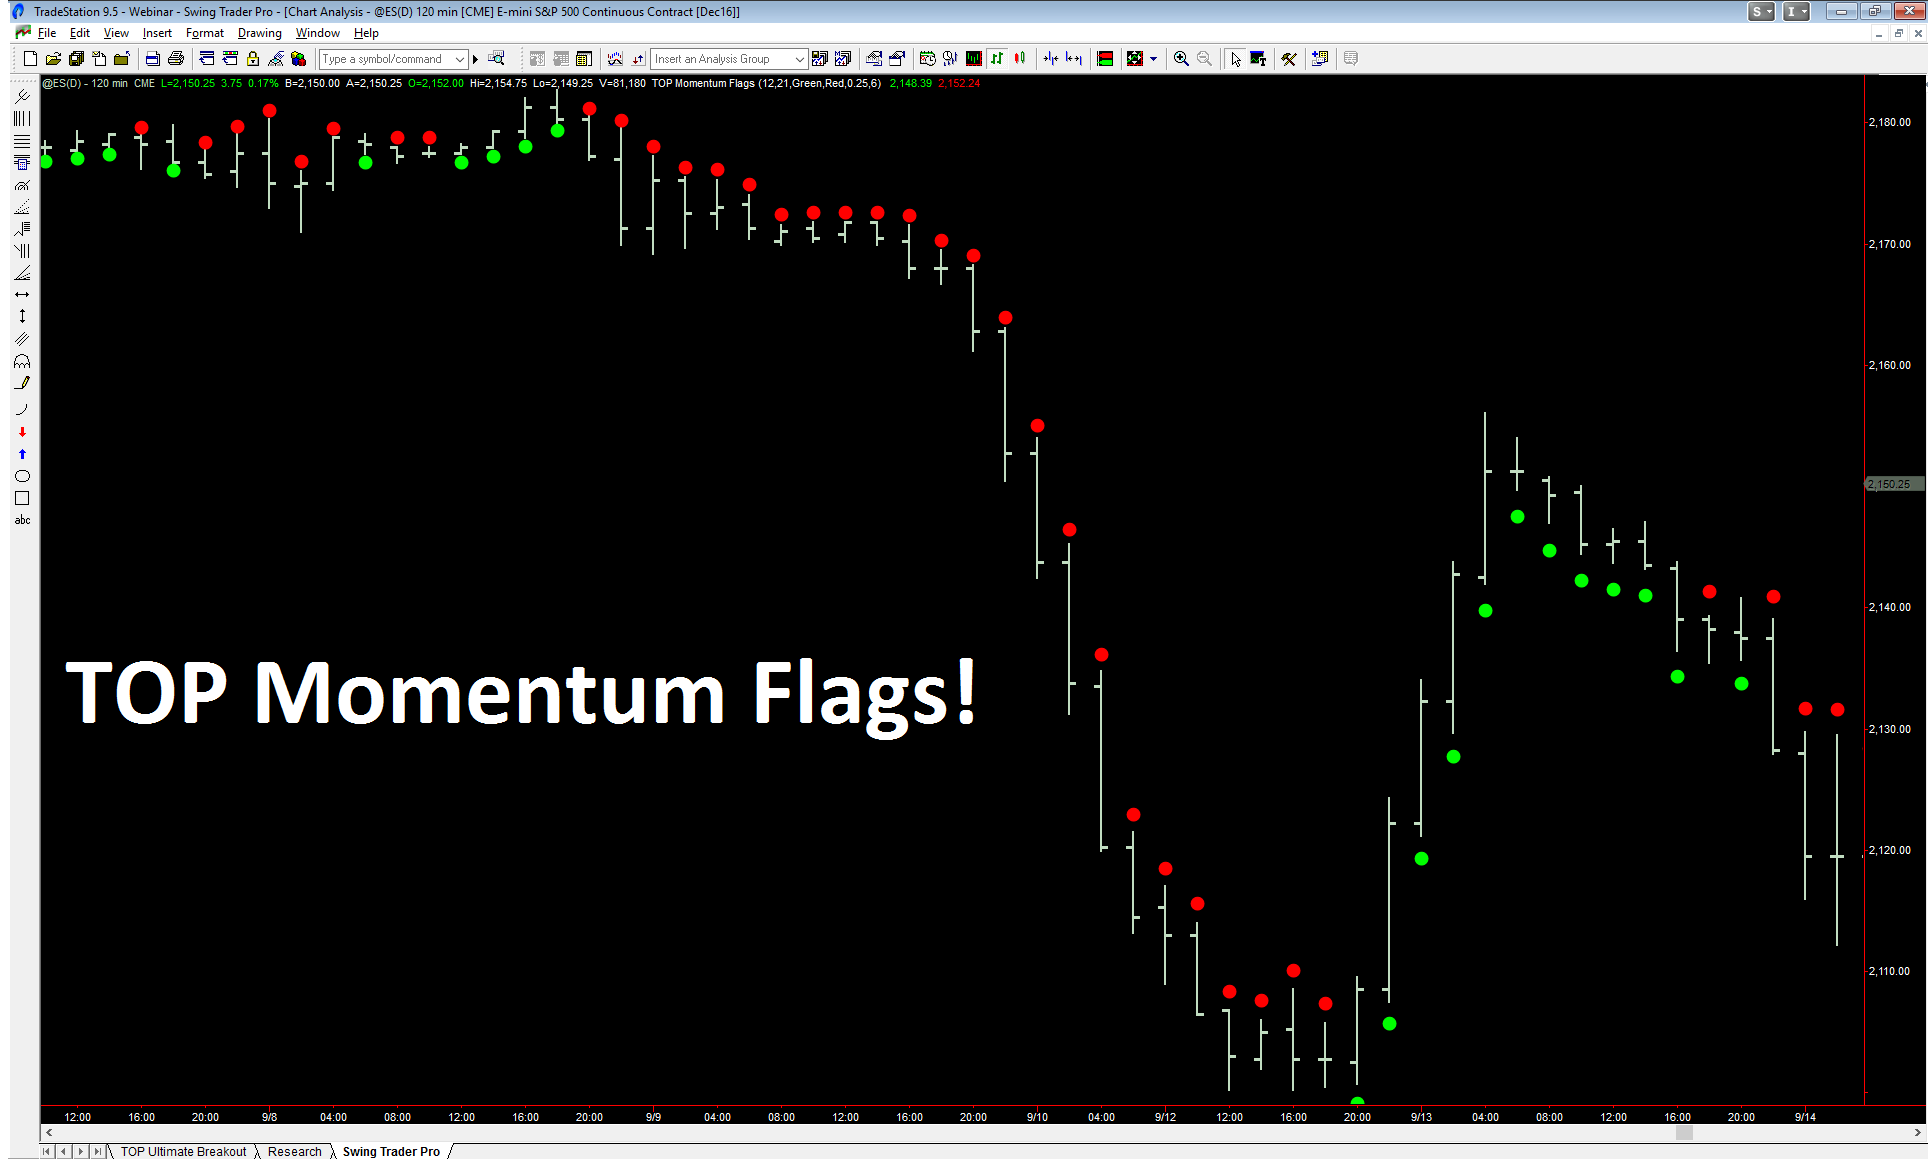
Most professional traders agree that a clear momentum picture of any market can be a powerful forecaster of future price moves. Market momentum communicates the raw power of buyers and sells and the force that they are willing to exert on a market. Subtle changes in momentum can provide powerful clues that a market is about to accelerate or even reverse. The TOP Momentum Flags indicator has been designed to give professional traders several powerful advantages over traditional momentum indicators.
Quick Trigger Technology
When market momentum turns or accelerates, it pays to have a professional grade tool that can quickly detect market momentum changes. See in the chart below how the TOP Momentum Flags indicator can generate timely color signal changes to detect quick changes in market momentum.
In the S&P 500 futures example above, you can clearly see how the TOP Momentum Bars indicator was quick to react when market momentum and direction changed. In today’s fast paced markets, reaction speed to changing market conditions can make the difference between making profits and realizing losses.
Risk Disclaimer: There is a risk of loss in trading and past performance is not necessarily indicative of future results.
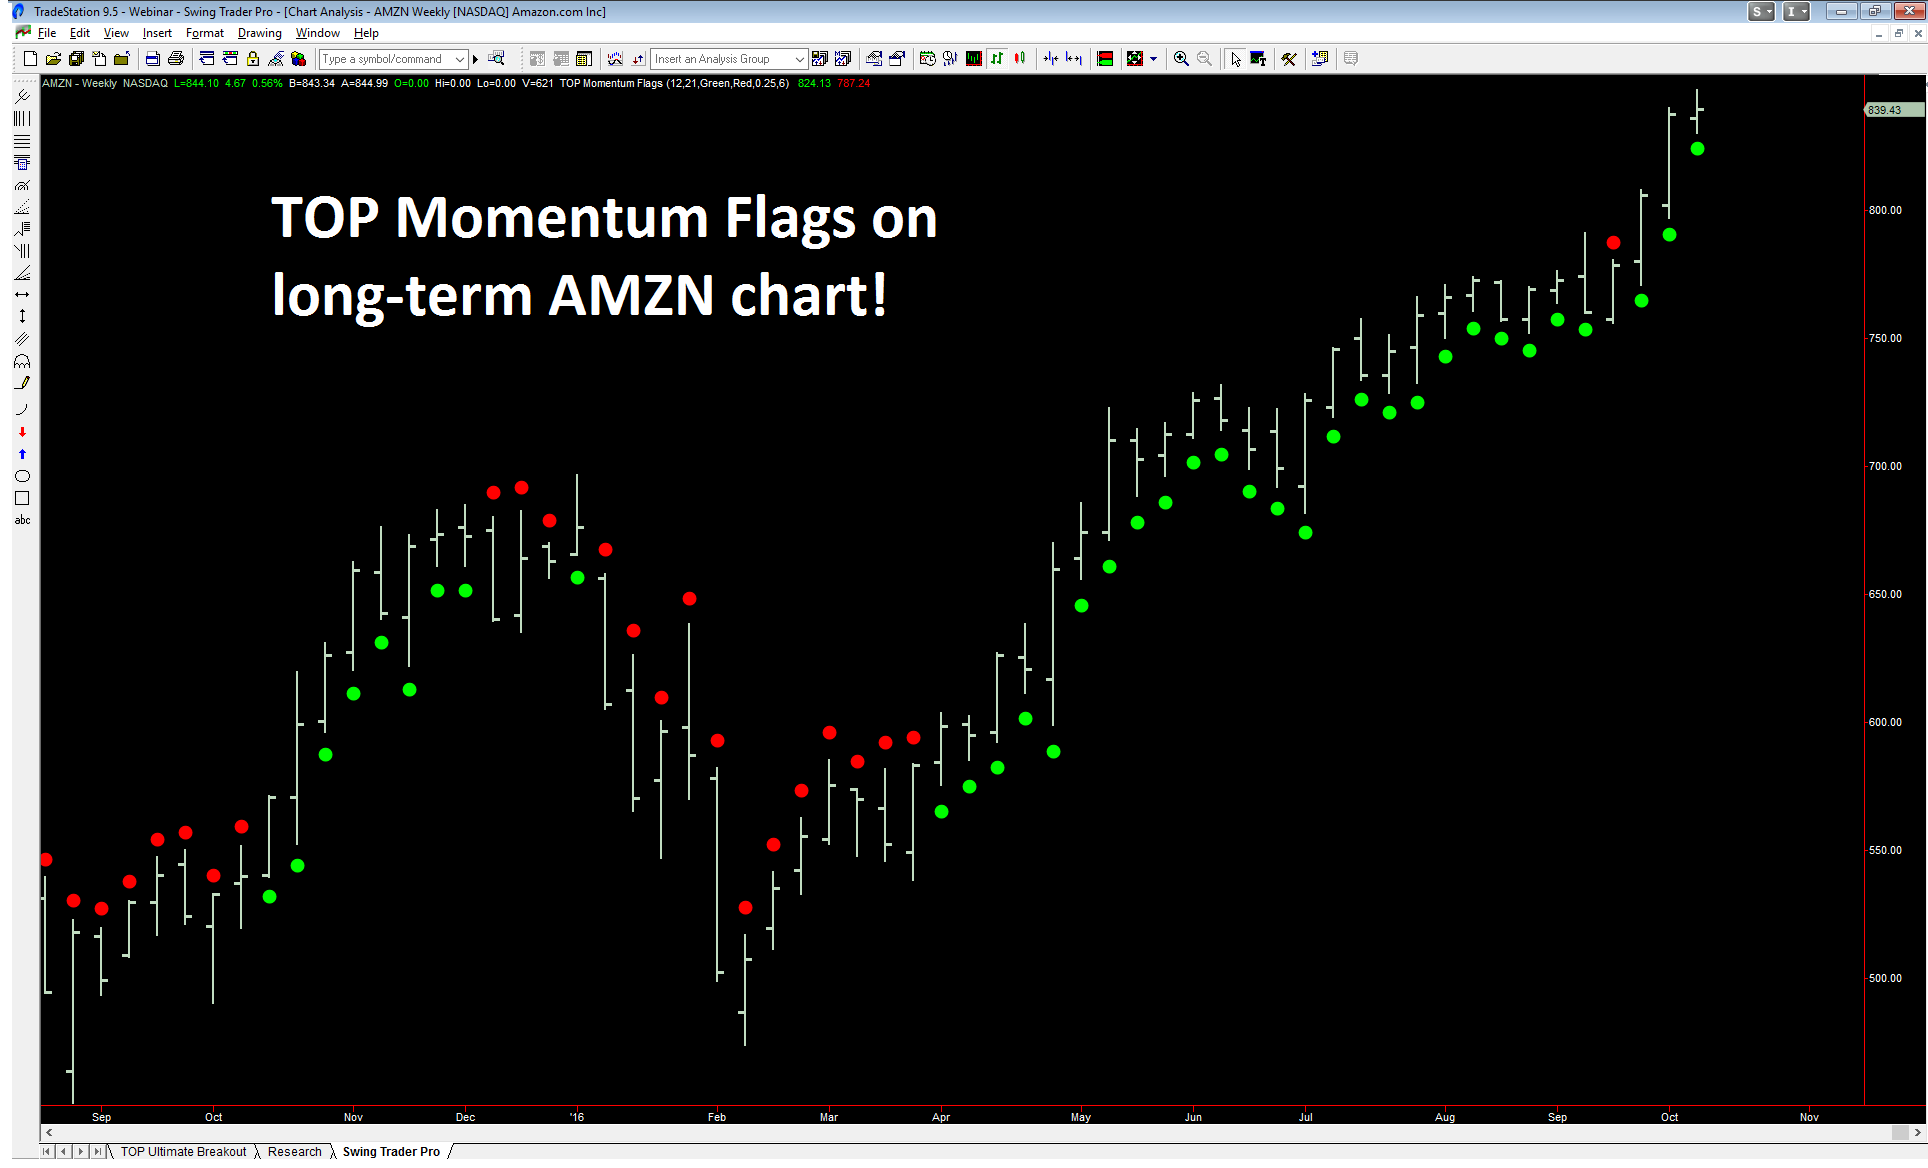
When market momentum changes, you need to be able to react. Many professional traders track long-term market momentum to determine the direction of the underlying trend. As you can see in the AMZN chart above, long-term momentum patterns are worth monitoring.
Find Momentum Based Setups
Professional traders will tell you that high probability trade setups can dramatically increase your odds for making money in the markets. There are a number of powerful momentum based trade setups that you can identify using the TOP Momentum Flags indicator combined with other indicators. You can also use TOP Momentum Flags to manage your trade upon seeing a high probability trade setup.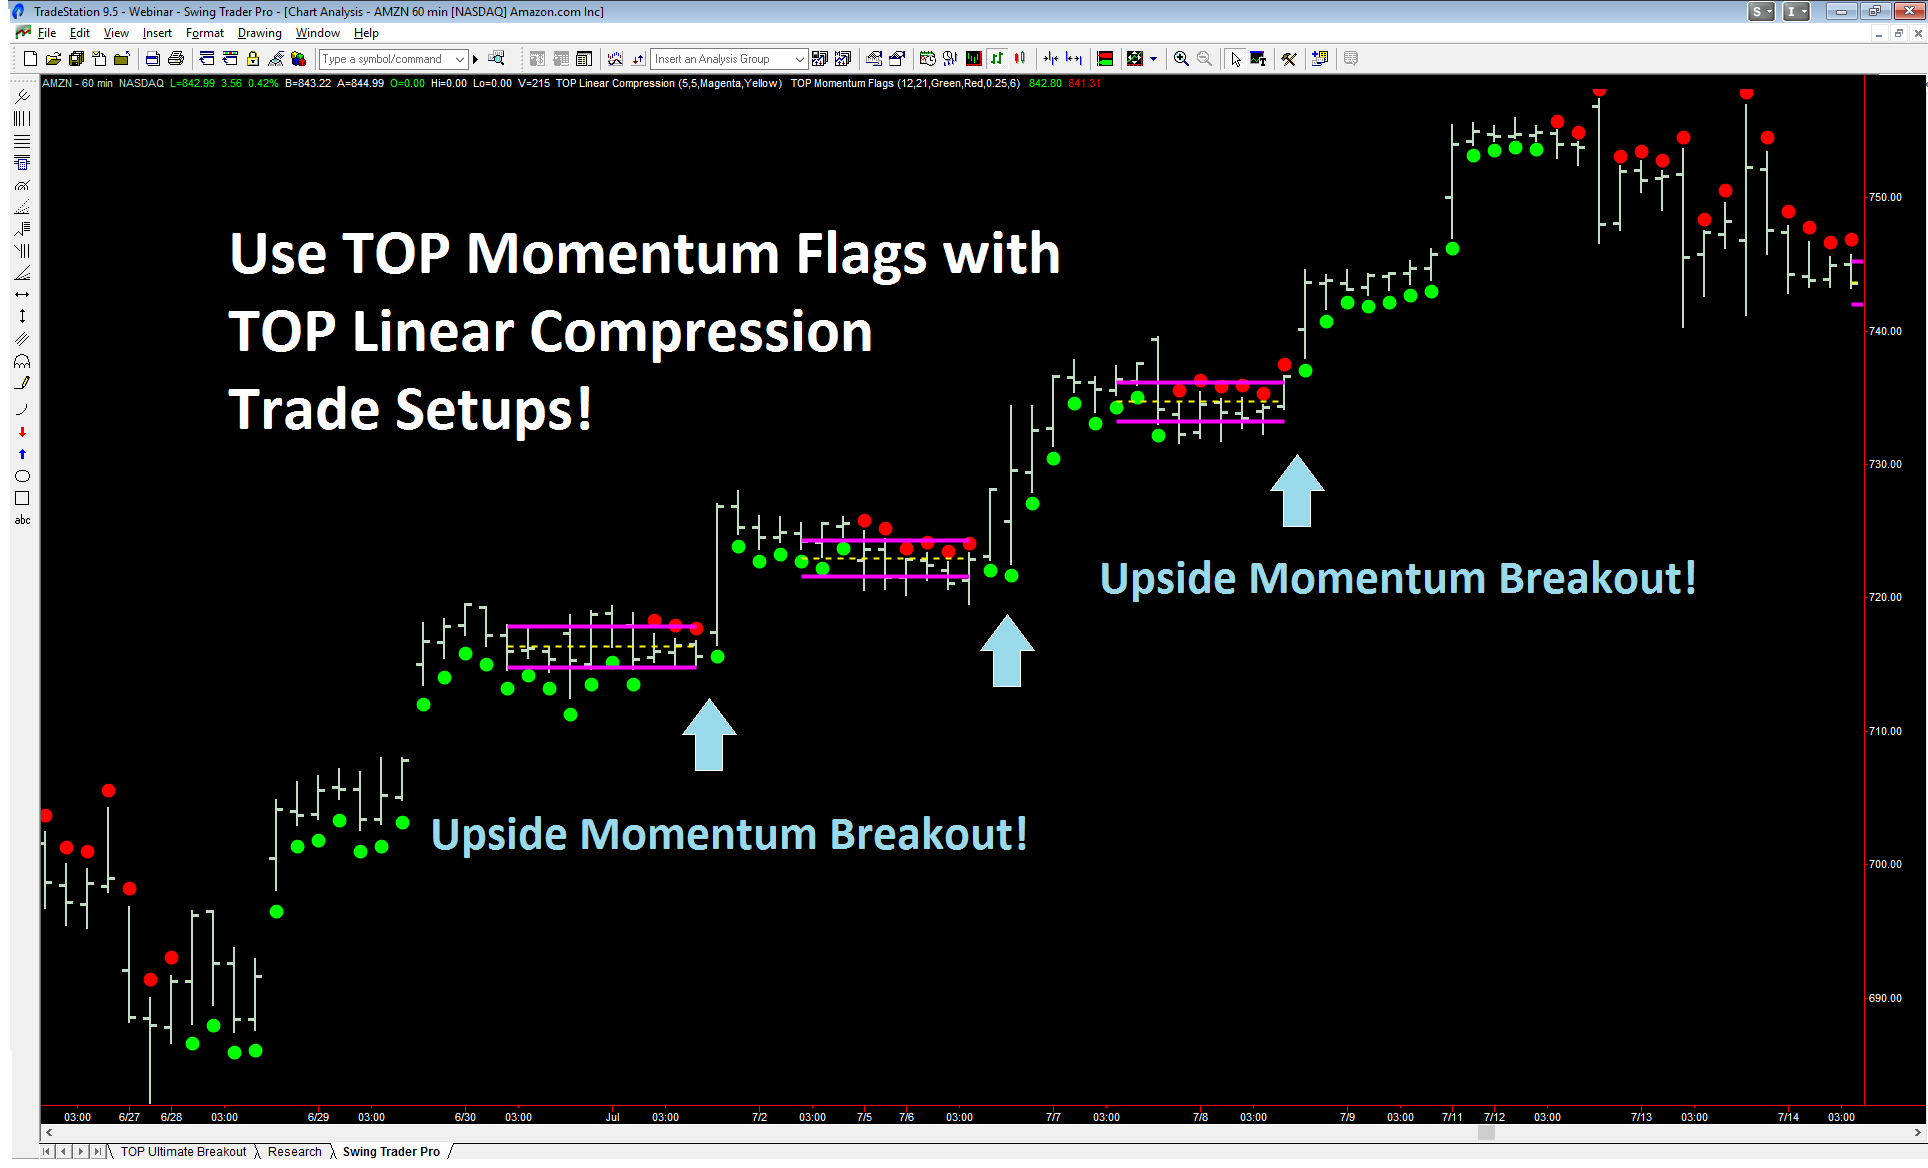
The linear compression setups identified by the TOP Linear Compression indicator in the AMZN chart above can be combined with TOP Momentum Flags to create a powerful one-two punch strategy! TOP Momentum Flags are a great tool to confirm the direction of price momentum after trade setups are identified.
Simple Indicator Parameters
We have designed the TOP Momentum Flags indicator to be both powerful and easy to use. Our default settings represent our recommended settings. However, if you wish, you can adjust the TOP Momentum Flags indicator settings to focus on longer-term or shorter-term market momentum by modifying the MomLength and SmoothLength parameters. You can also modify the flag (dot) colors, the distance that flags (dots) are positioned from price bars, and the size of flags (dots).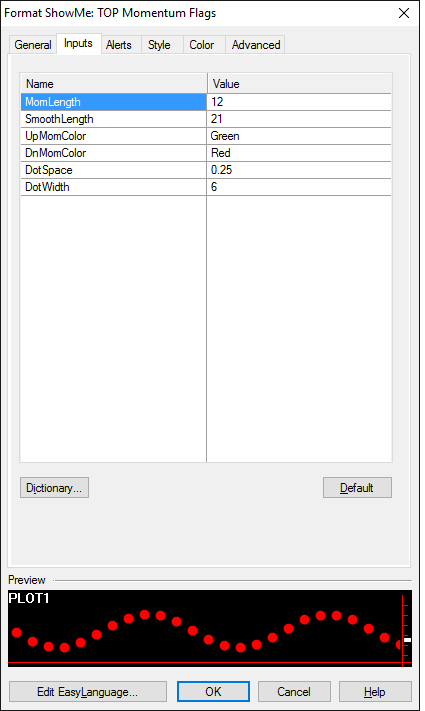
Get the TOP Momentum Flags Advantage Today!
Both new traders and professional traders alike can benefit from the power of the TOP Momentum Flags indicator for day trading, swing trading, and trend trading. The TOP Momentum Flags indicator can be used to trade Stocks, Bonds, ETFs, Options, Futures, FOREX, and CFDs. Now you can learn to find high probability trade setups combined with the TOP Momentum Flags indicator to manage your trade. Not all momentum indicators are alike. Get the professional grade TOP Momentum Flags advantage today by clicking the button below!IMPORTANT NOTICE AND DISCLAIMER
Futures, Options, and Currency trading all have large potential rewards, but they also have large potential risk. You must be aware of the risks and be willing to accept them in order to invest in these markets. Don’t trade with money you can’t afford to lose. This website is neither a solicitation nor an offer to Buy or Sell stocks, options, futures, of FOREX. No representation is being made that any account will or is likely to achieve profits or losses similar to those discussed on this web site. The past performance of any trading system or methodology is not necessarily indicative of future results. TopTradeTools.com, including any of its affiliates, will not be liable for any indirect, incidental, or consequential losses or damages which may include but are not limited to any kind of losses or lost profits that may result from either technology or material. No representation is being made that the use of this strategy or any system or trading methodology will generate profits. Past performance is not necessarily indicative of future results. There is substantial risk of loss associated with trading securities and options on equities, options, futures, and FOREX markets. Only risk capital should be used to trade. Trading securities is not suitable for everyone. Disclaimer: posted on this website or in our presentations.
CFTC RULE 4.41 – HYPOTHETICAL OR SIMULATED PERFORMANCE RESULTS HAVE CERTAIN LIMITATIONS. UNLIKE AN ACTUAL PERFORMANCE RECORD, SIMULATED RESULTS DO NOT REPRESENT ACTUAL TRADING. ALSO, SINCE THE TRADES HAVE NOT BEEN EXECUTED, THE RESULTS MAY HAVE UNDER-OR-OVER COMPENSATED FOR THE IMPACT, IF ANY, OF CERTAIN MARKET FACTORS, SUCH AS LACK OF LIQUIDITY. SIMULATED TRADING PROGRAMS IN GENERAL ARE ALSO SUBJECT TO THE FACT THAT THEY ARE DESIGNED WITH THE BENEFIT OF HINDSIGHT. NO REPRESENTATION IS BEING MADE THAT ANY ACCOUNT WILL OR IS LIKELY TO ACHIEVE PROFIT OR LOSSES SIMILAR TO THOSE SHOWN.