

TOP Linear Compression
with Volatility Crush Pattern Recognition
The TOP Linear Compression indicator is designed to identify volatility crush compression trade setups for any market and timeframe combination.
Designed for Stocks, Bonds, Commodities, Futures, FOREX, and Options trading. TOP Linear Compression is a powerful tool that can be used for Day Trading, Swing Trading, and for strategic entry Trend Trading! Effective on both intraday and end-of-day price charts including 5 minute charts, 60 minute charts, daily charts, weekly charts, and tick charts to name a few.
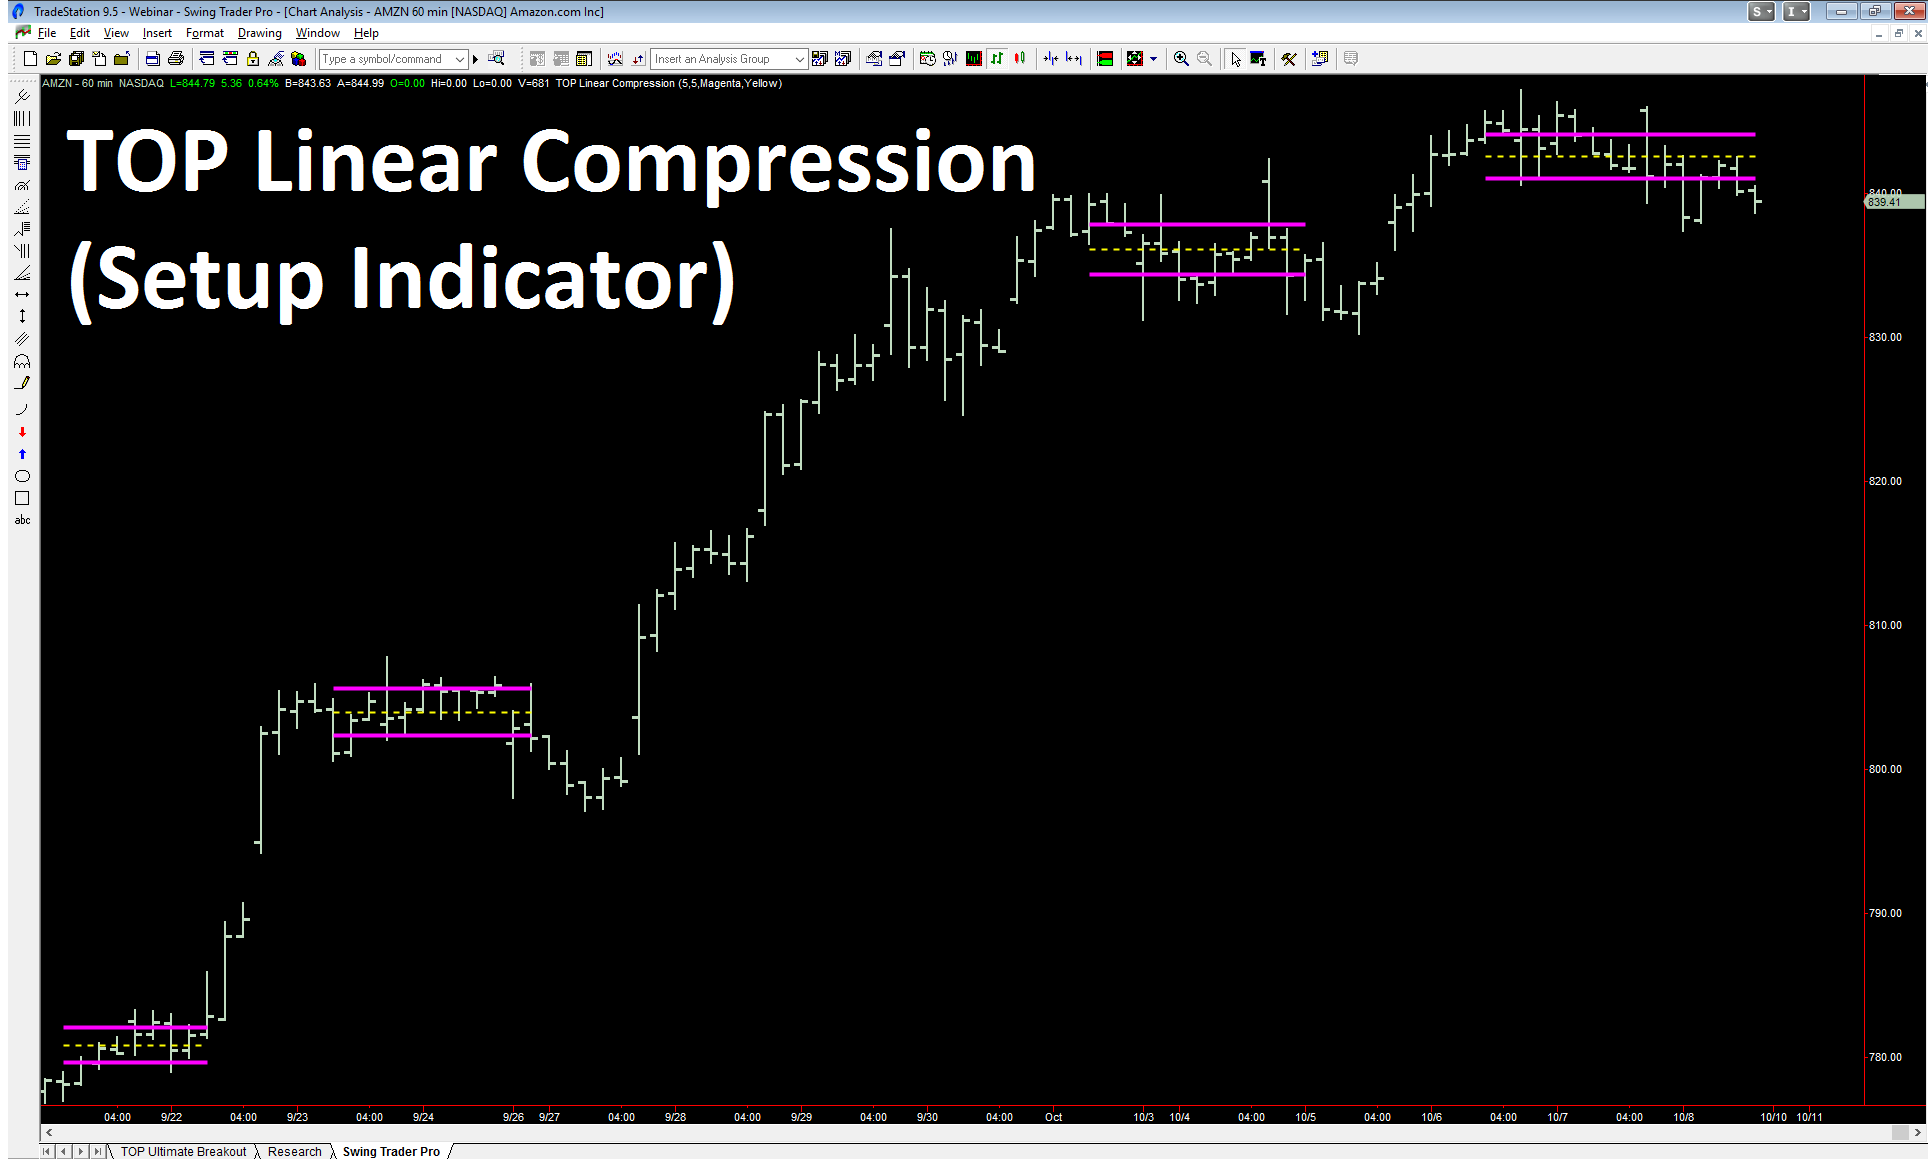
Markets tend to enter into volatility compression periods where significant energy can be stored for a future release. These volatility compression periods are often followed by volatility explosions where stored energy is quickly released and, as a result, prices experiences a sizable move to the upside or the downside. Some traders like to think of this as markets releasing energy when the slow compression periods ends by transitioning into a much more active periods that release stored energy and make up for lost time.

The volatility compression or “squeeze” trade setups have become increasingly popular in recent years. To help traders take advantage of these trading opportunities, we have developed a professional grade version of volatility compression pattern recognition software called the TOP Linear Compression indicator.
Using a compression pattern recognition algorithm, the TOP Linear Compression is designed to identify meaningful market price compression periods for any market and timeframe combination. Our empirical research has shown us that compression setups can be valid on all timeframes, including intraday price timeframes and end-of-day timeframes.
Easy to Use Pattern Recognition Tool
Using linear based design components, we designed the TOP Linear Compression indicator to be both visually attractive and easy to use. Each TOP Linear Compression setup is plotted by using upper and lower linear boundary lines along with a center linear reference line. Because each price compression setup is unique in duration, the TOP Linear Compression indicator plots the unique setup length associated with each volatility compression trade setup.
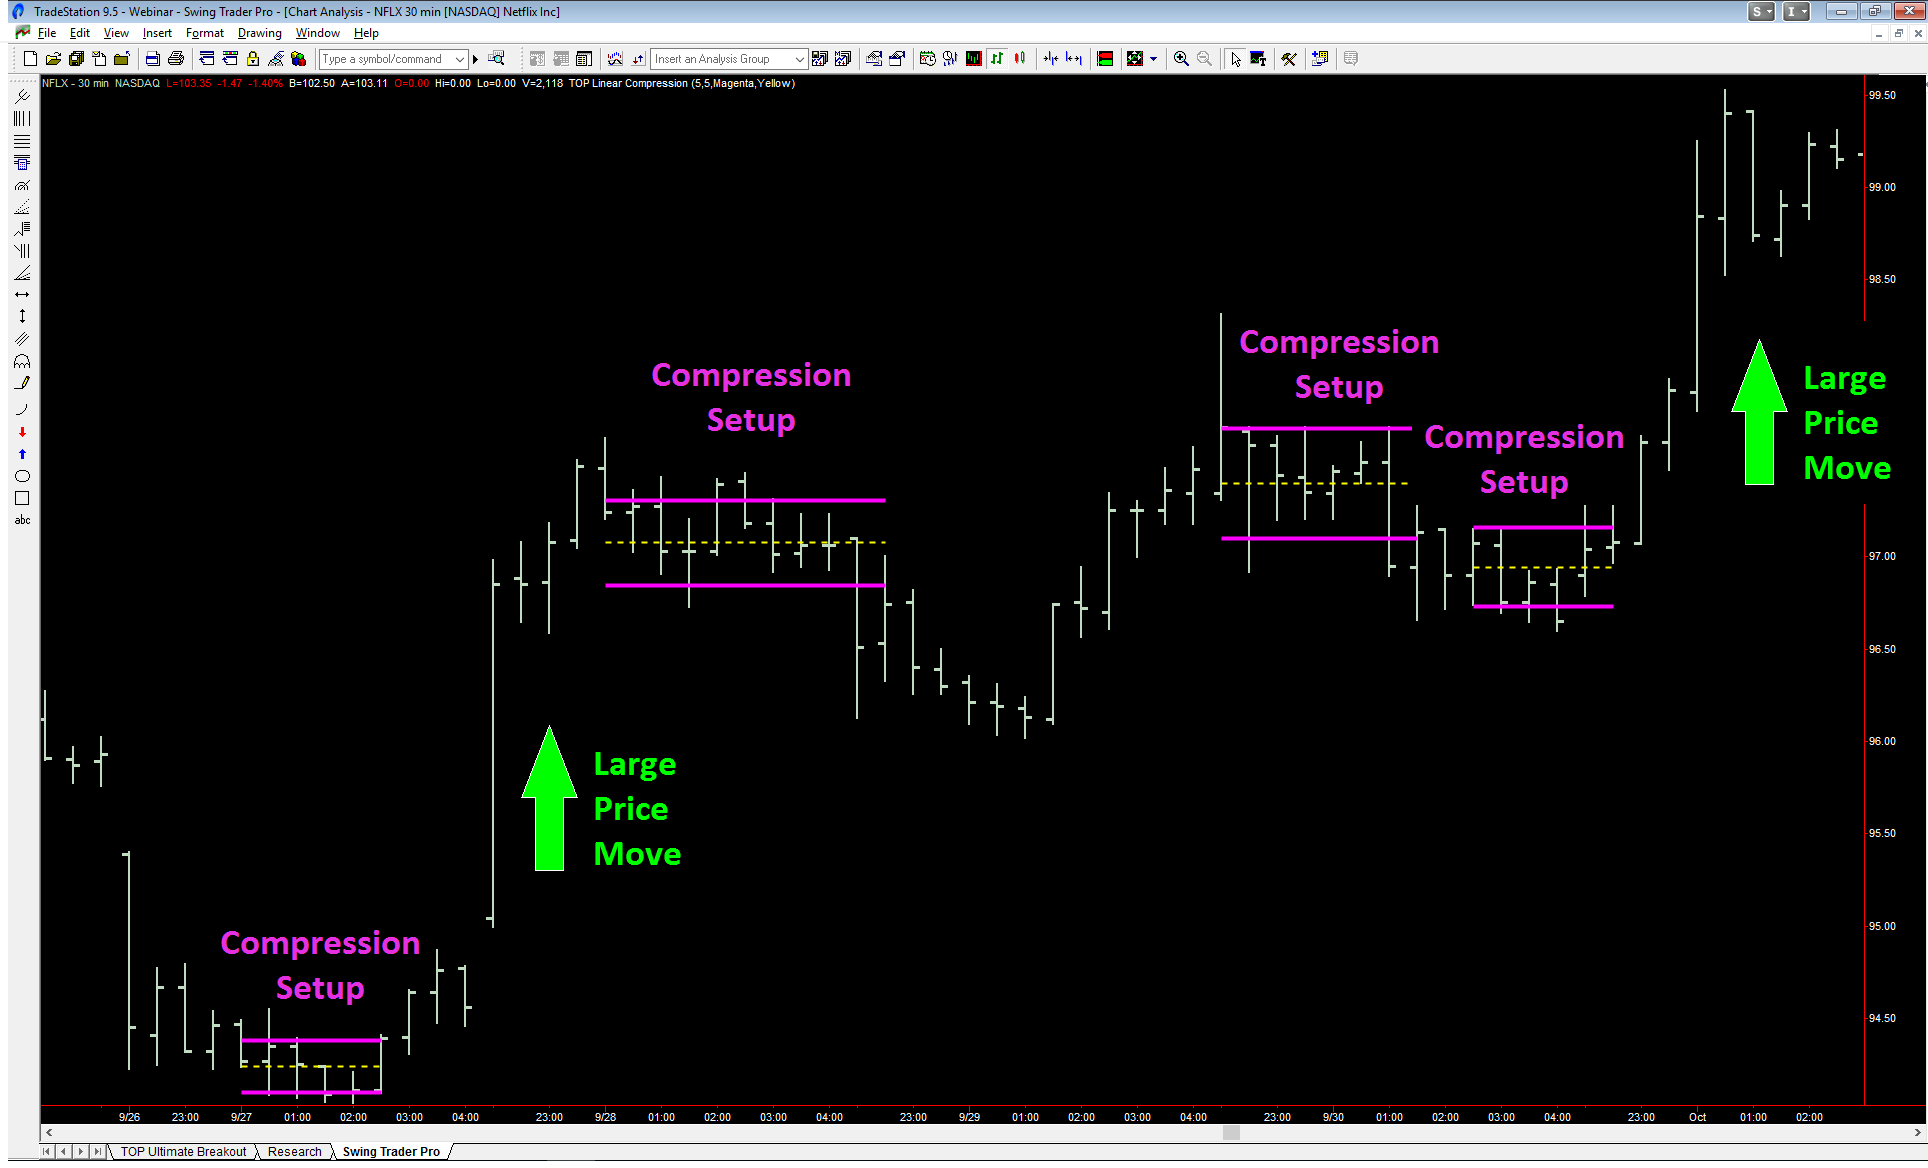
You can see in the NFLX 30 minute chart above that not all volatility compression trade setups result in large price moves where energy is released. However, as many professional traders will tell you, when the sizable “energy releasing” price moves occur, linear compression setups can represent excellent profit opportunities.
Using a Strategy with Volatility Compression Setups
One powerful way to potentially profit from TOP Linear Compression setups is to take rule-based strategy trade signals following these volatility compression trade setups. We believe that one of the most powerful ways to trade markets is to combine high probability trades setups with professional grade trading strategies. Let’s take a look at a hypothetical trading example below (see trading risk disclaimer at the bottom of this webpage).
In the example below, we apply the TOP Momentum Trader 4 along with the TOP Linear Compression indicator to a 30 minute chart of Amazon. Our strategy is simple – take the trade signals from TOP Momentum Trader 4 after any TOP Linear Compression trade immediately following volatility compression trade setups.
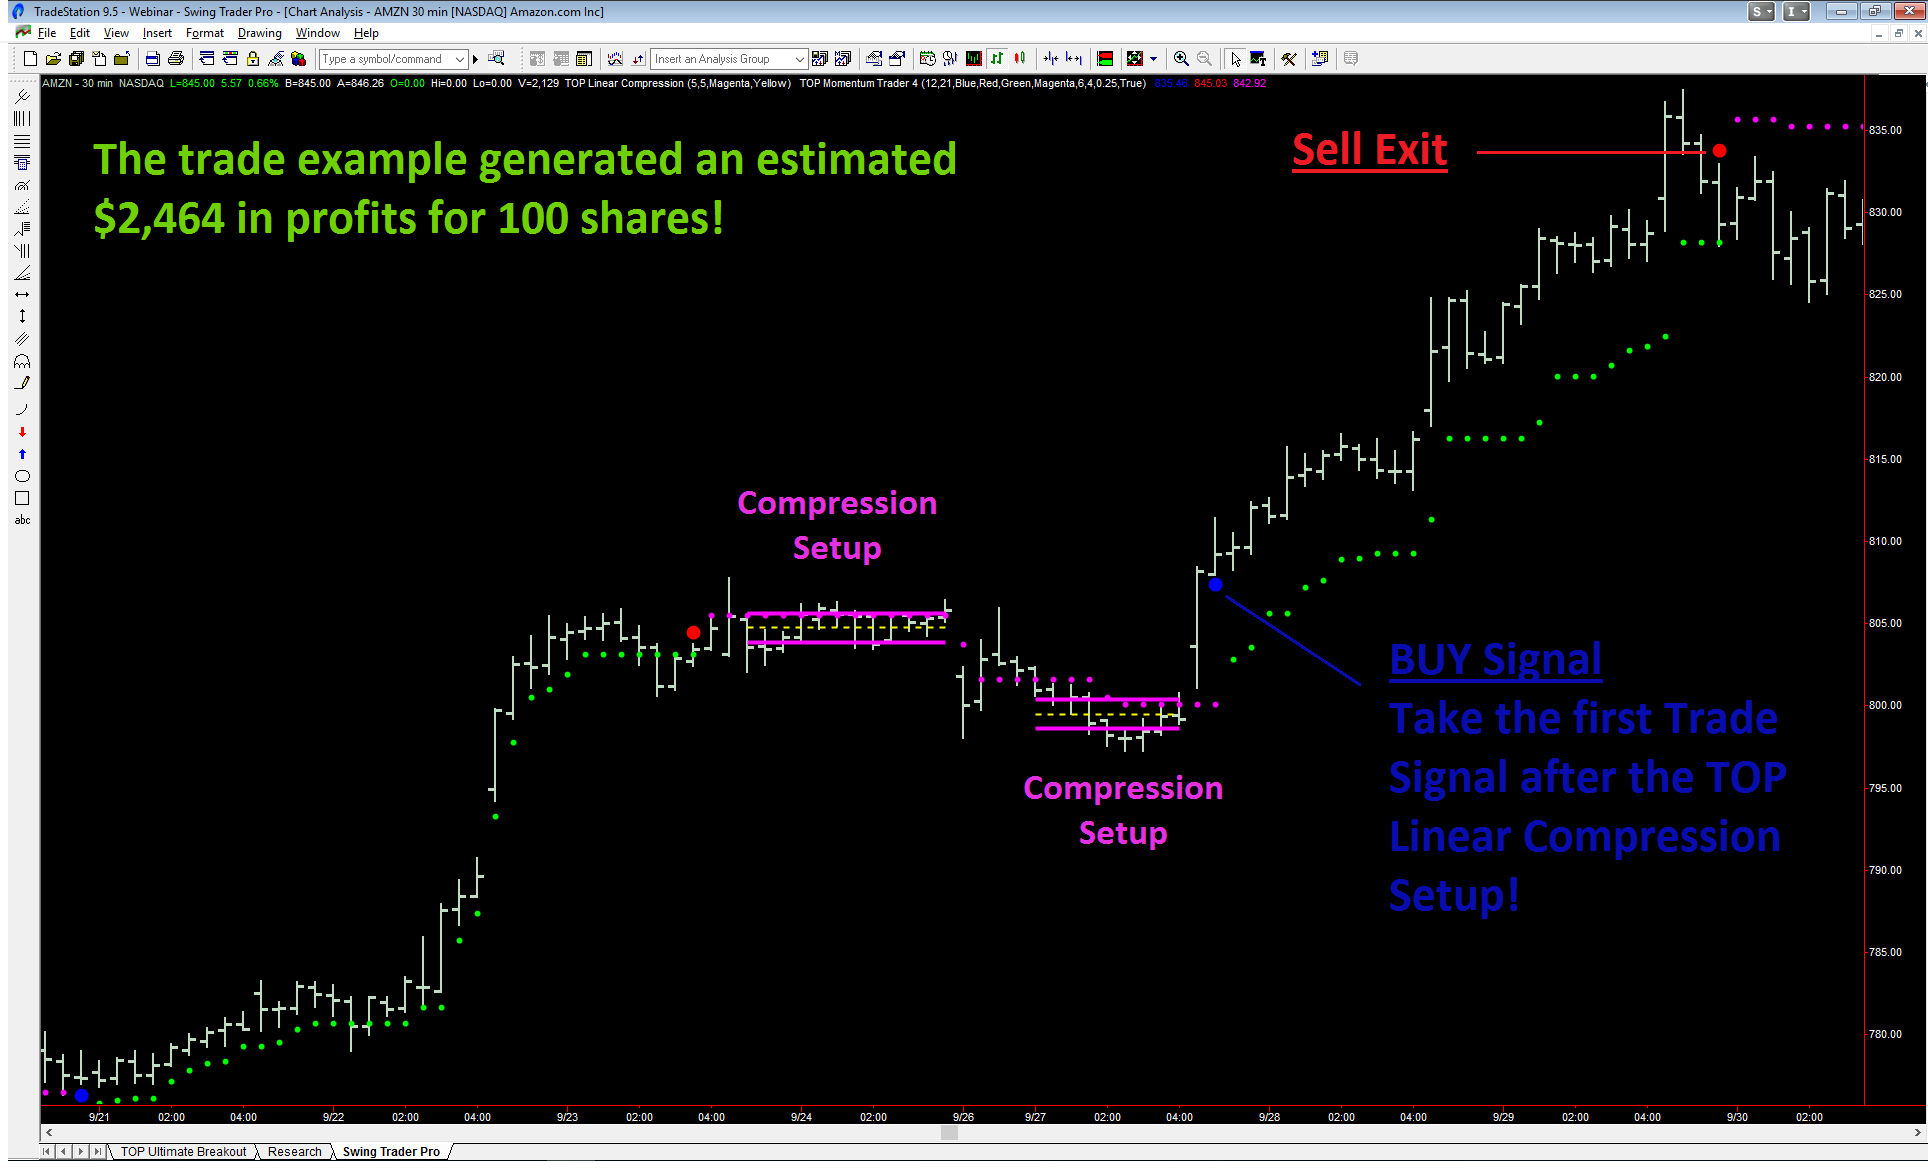
In the AMZN 30 minute chart example above, the TOP Momentum Trader 4 buy signal immediately following the volatility compression trade setup identified by TOP Linear Compression generated estimated profits of $2,464 for 100 shares of Amazon stock, excluding commission, slippage, and trading fees. This example demonstrates the strong potential profits that can be realized after a TOP Linear Compression trade setup (hypothetical trade risk disclaimer at the bottom of webpage).
Now, it is important to understand that not all TOP Linear Compression trade setups will lead to strong, explosive price moves. There is no trade setup in the world that can guarantee results every time. The key, in our opinion, is to find volatility compression periods in markets that tend to be more volatile over time. Stay away from thinly traded, inactive markets.
Risk Disclaimer: There is a risk of loss in trading and past performance is not necessarily indicative of future results.
Simple Indicator Parameters
We have designed the TOP Linear Compression indicator to be both powerful and easy to use. Our default settings represent our recommended settings. However, if you wish, you can adjust the TOP Linear Compression settings to refine your volatility compression setup search using your preferred parameter settings.
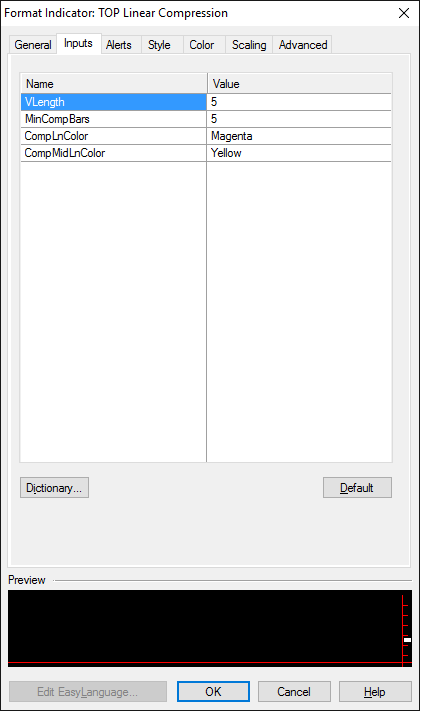
The VPeriod parameter will modify the volatility algorithm look back period. Smaller values for this parameter will make the TOP Linear Compression indicator more reactive and larger values will make it less reactive to volatility compressions. The MinCompBars (Minimum Compression Bars) parameter defines the minimum number of price bars that you require for a TOP Linear Compression trade setup to be plotted. A value of 5 means that there must be a volatility compression for at least 5 price bars before a plot is generated. The last two parameters simply allow you to select the colors of the TOP Linear Compression setup lines.
Get the TOP Linear Compression Advantage Today!
Both new traders and professional traders alike can benefit from the power of the TOP Linear Compression indicator for day trading, swing trading, and trend trading. The TOP Linear Compression indicator can be used to trade Stocks, Bonds, ETFs, Options, Futures, FOREX, and CFDs. Now you can learn to find high probability trade setups based on volatility compression using the TOP Linear Compression indicator. Get the professional grade TOP Linear Compression advantage today by clicking the button below!
IMPORTANT NOTICE AND DISCLAIMER
Futures, Options, and Currency trading all have large potential rewards, but they also have large potential risk. You must be aware of the risks and be willing to accept them in order to invest in these markets. Don’t trade with money you can’t afford to lose. This website is neither a solicitation nor an offer to Buy or Sell stocks, options, futures, of FOREX. No representation is being made that any account will or is likely to achieve profits or losses similar to those discussed on this web site. The past performance of any trading system or methodology is not necessarily indicative of future results. TopTradeTools.com, including any of its affiliates, will not be liable for any indirect, incidental, or consequential losses or damages which may include but are not limited to any kind of losses or lost profits that may result from either technology or material. No representation is being made that the use of this strategy or any system or trading methodology will generate profits. Past performance is not necessarily indicative of future results. There is substantial risk of loss associated with trading securities and options on equities, options, futures, and FOREX markets. Only risk capital should be used to trade. Trading securities is not suitable for everyone. Disclaimer: posted on this website or in our presentations.
CFTC RULE 4.41 – HYPOTHETICAL OR SIMULATED PERFORMANCE RESULTS HAVE CERTAIN LIMITATIONS. UNLIKE AN ACTUAL PERFORMANCE RECORD, SIMULATED RESULTS DO NOT REPRESENT ACTUAL TRADING. ALSO, SINCE THE TRADES HAVE NOT BEEN EXECUTED, THE RESULTS MAY HAVE UNDER-OR-OVER COMPENSATED FOR THE IMPACT, IF ANY, OF CERTAIN MARKET FACTORS, SUCH AS LACK OF LIQUIDITY. SIMULATED TRADING PROGRAMS IN GENERAL ARE ALSO SUBJECT TO THE FACT THAT THEY ARE DESIGNED WITH THE BENEFIT OF HINDSIGHT. NO REPRESENTATION IS BEING MADE THAT ANY ACCOUNT WILL OR IS LIKELY TO ACHIEVE PROFIT OR LOSSES SIMILAR TO THOSE SHOWN.