Gamma Bundle
TOP Gamma BarsTM (ColorBars)
for Identifying High Energy Gamma BarsTM for Options Traders
Welcome to the hottest new way to trade weekly options using Gamma BarsTM. The TOP Gamma BarsTM (ColorBars) indicator is designed to identify high profit potential bullish and bearish Gamma BarsTM, which can represent explosive growth option trading opportunities.
The weekly Gamma BarsTM (ColorBars) strategy can be used to trade options on stocks, ETFs, stock indexes, futures, and options on forex markets. The Gamma BarsTM options trading strategy is ideal for working professionals who can’t sit in front of trading screens during the work day.
Correctly forecasting weekly bullish or bearish Gamma BarsTM can be extremely profitable when trading weekly options. The TOP Gamma BarsTM indicator makes it easy for option traders to identify Gamma BarsTM on weekly OHLC price charts. This has powerful applications for both studying past Gamma BarsTM history and for monitoring current Gamma BarsTM price bar development.
Gamma BarsTM – The Hottest New Way to Trade Weekly Options
This write-up is intended to describe the TOP Gamma BarsTM (ColorBars) indicator. If you are not familiar with the Gamma BarsTM trading strategy, then be sure to visit 3xOptions.com, home of Gamma BarsTM trading, for more information about the hottest new way to trade weekly options using Gamma BarsTM.
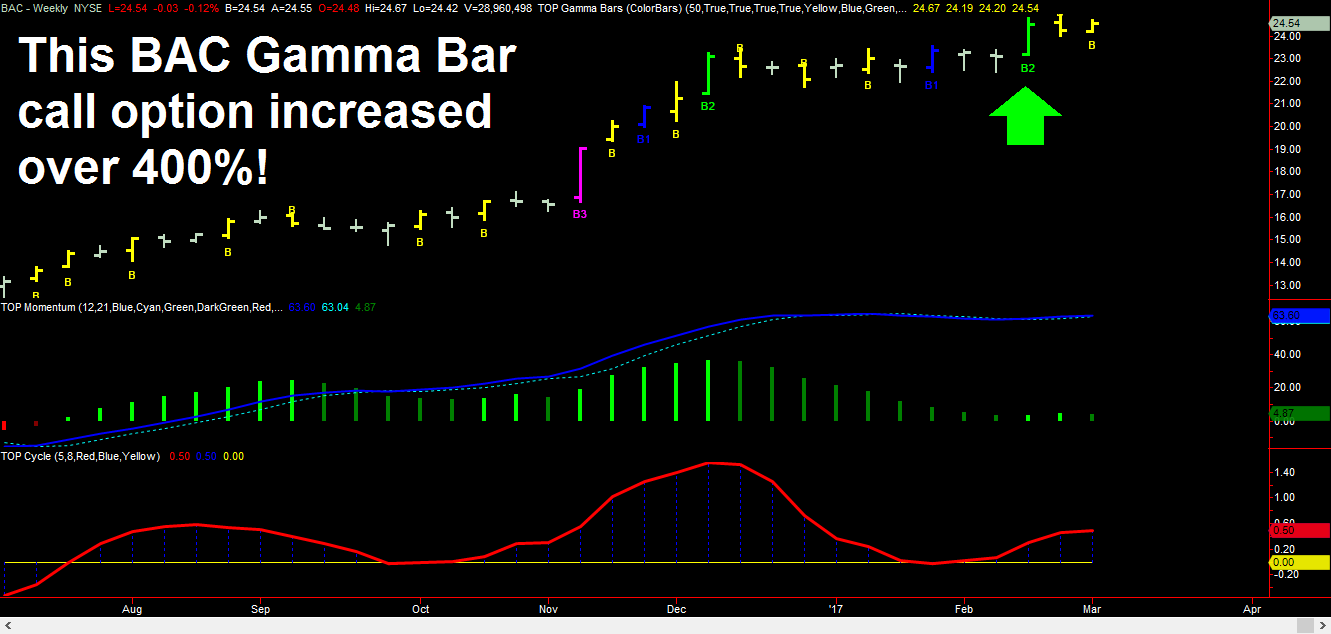
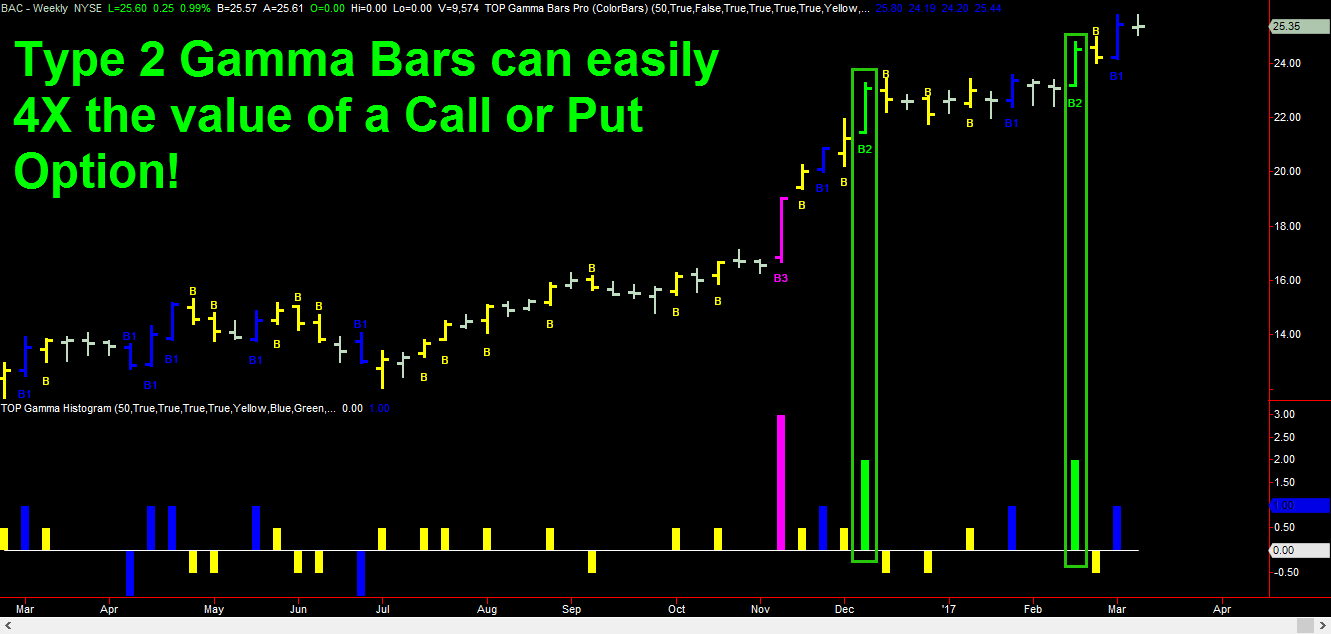
The Type 2 Gamma BarTM in the weekly BAC chart above (identified by the green arrow) caused the At the Money (ATM) BAC call options to increase by over 400% in a single week!
Disclaimer: There is a risk in trading options and past performance is not necessarily indicative of future results.
High Energy Gamma BarTM Types
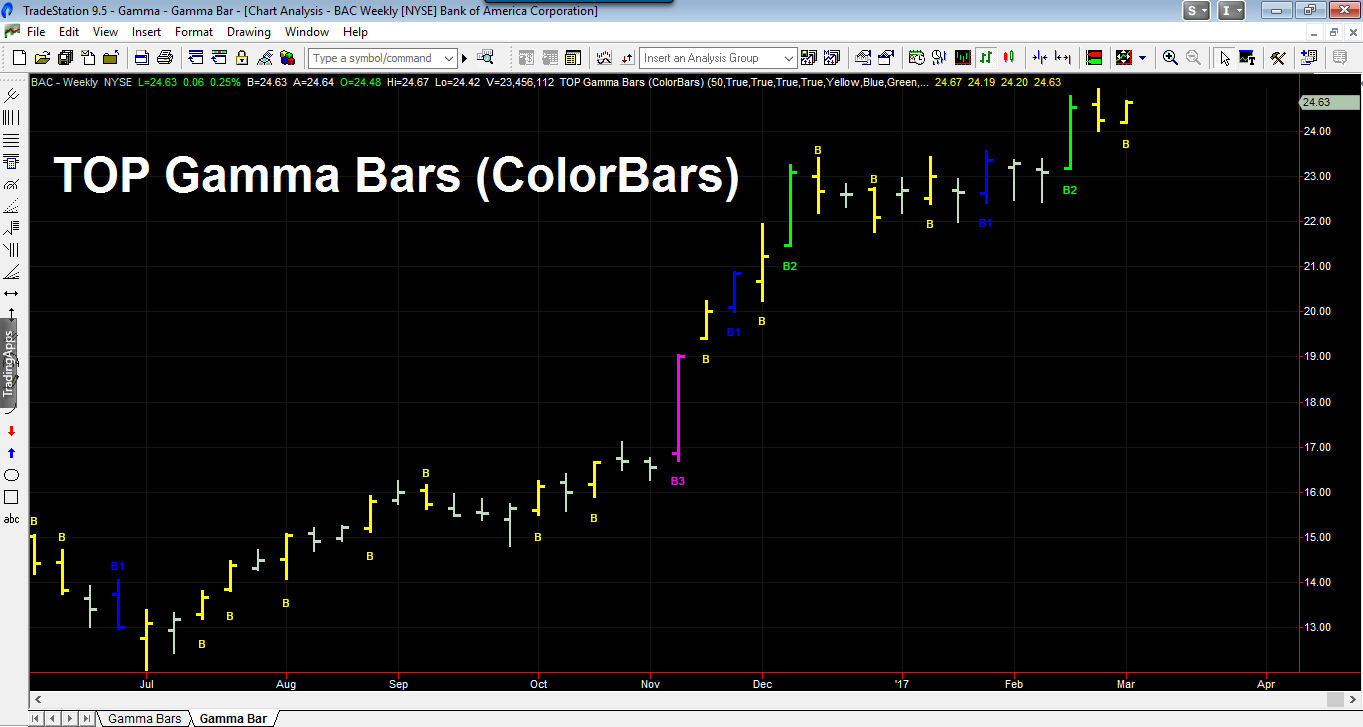
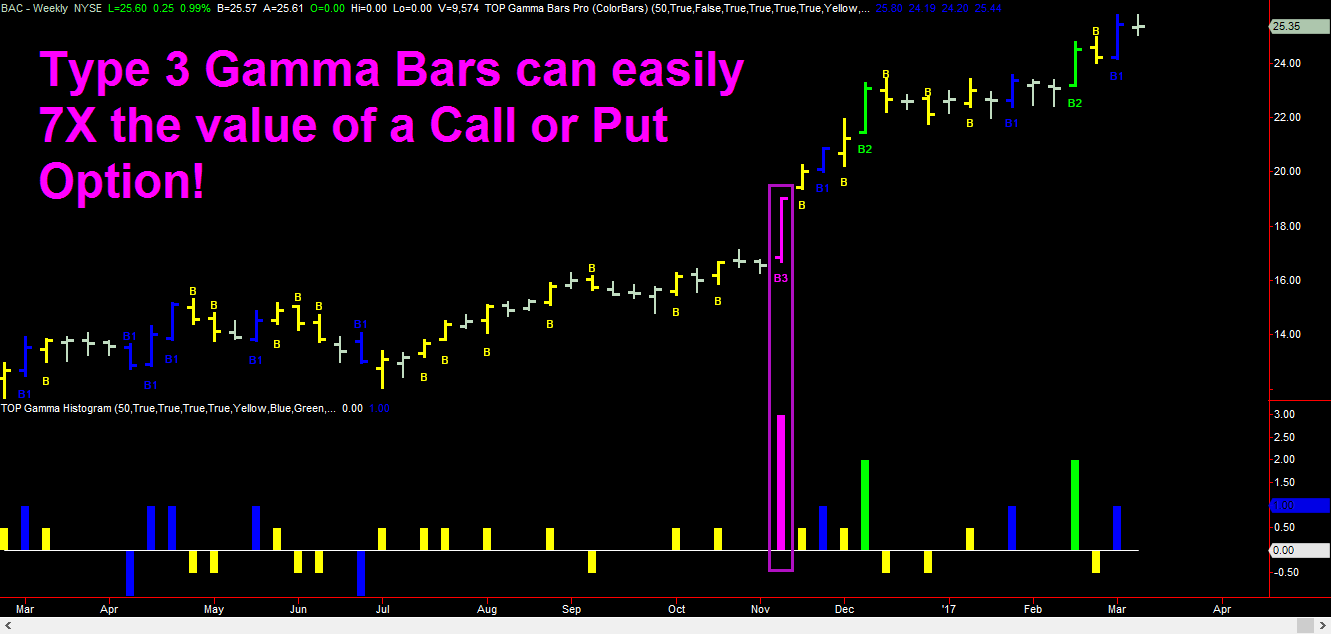
Gamma BarsTM can be bullish or bearish. Bullish Gamma BarsTM will have labels positioned below the Gamma BarsTM and bearish Gamma BarsTM will have labels positioned above the Gamma BarsTM (reference the BAC chart above to see examples of mostly Bullish Gamma BarsTM).
The different colors of the Gamma BarsTM distinguish the four different types, or magnitudes, of Gamma BarsTM. The four principal types of Gamma BarsTM include:
Types of Gamma BarsTM (from Weakest to Strongest)
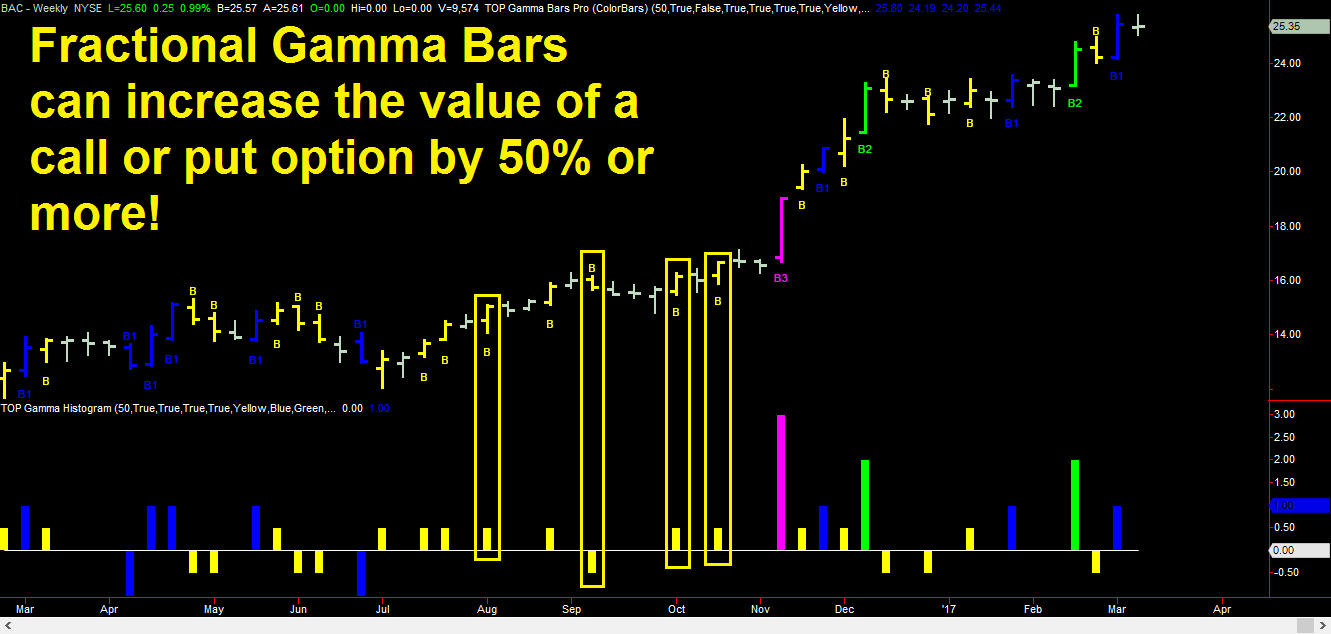
Fractional Gamma Bars (Yellow “B”) Type 1 Gamma Bars (Blue “B1”) Type 2 Gamma Bars (Green “B2”) Type 3 Gamma Bars (Magenta “B3”)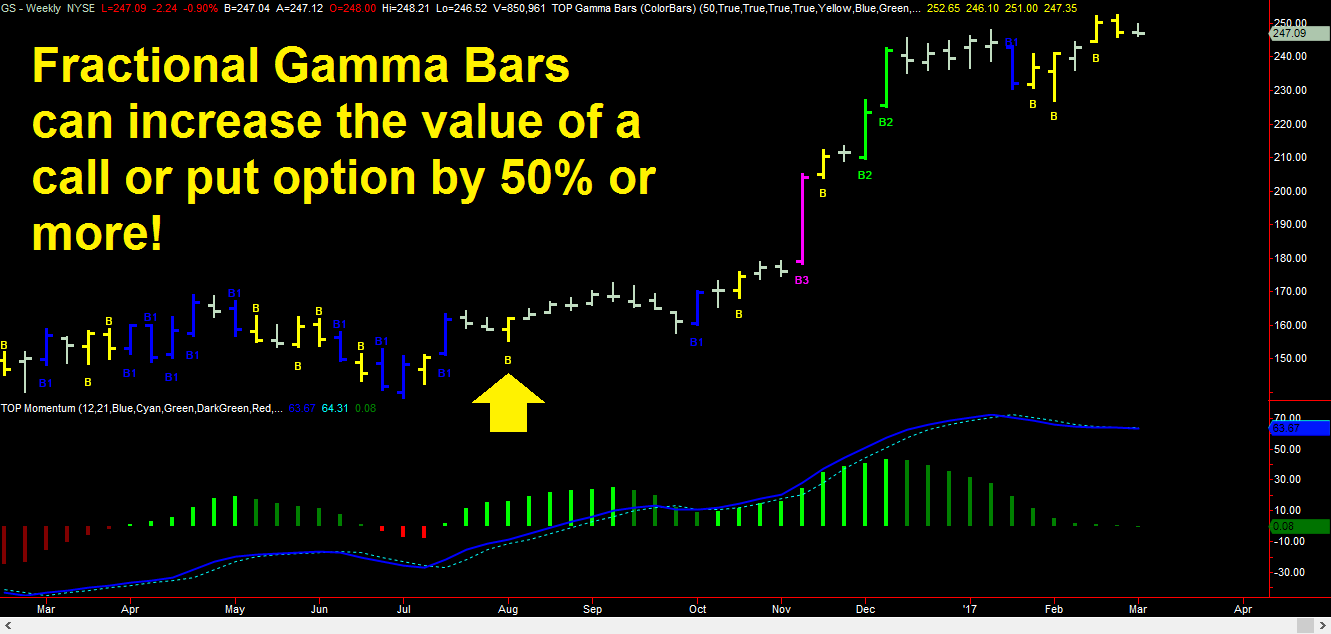
Fractional Gamma BarsTM represent moderate activity by either buyers or sellers. In general, Fractional Gamma BarsTM can generate moderately attractive profits for options traders. However, given that Fractional Gamma BarsTM are the weakest category or type of Gamma BarsTM, they can also experience flat to slightly negative option growth in certain instances.
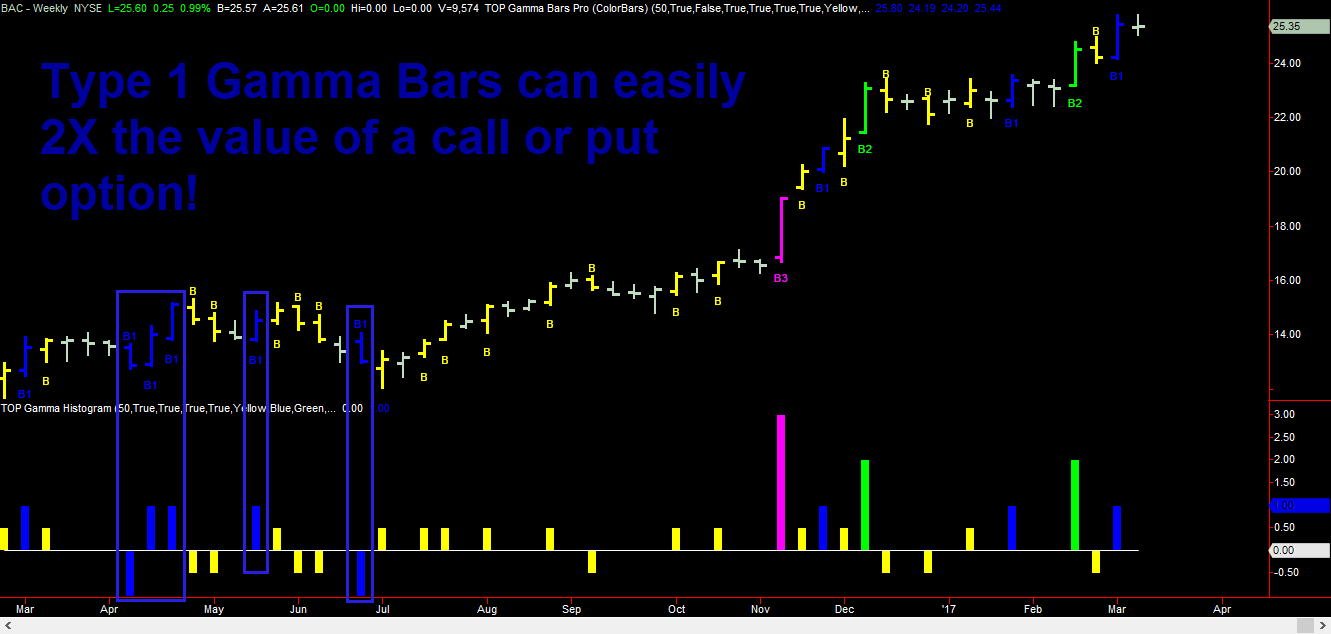
Type 1 Gamma BarTM
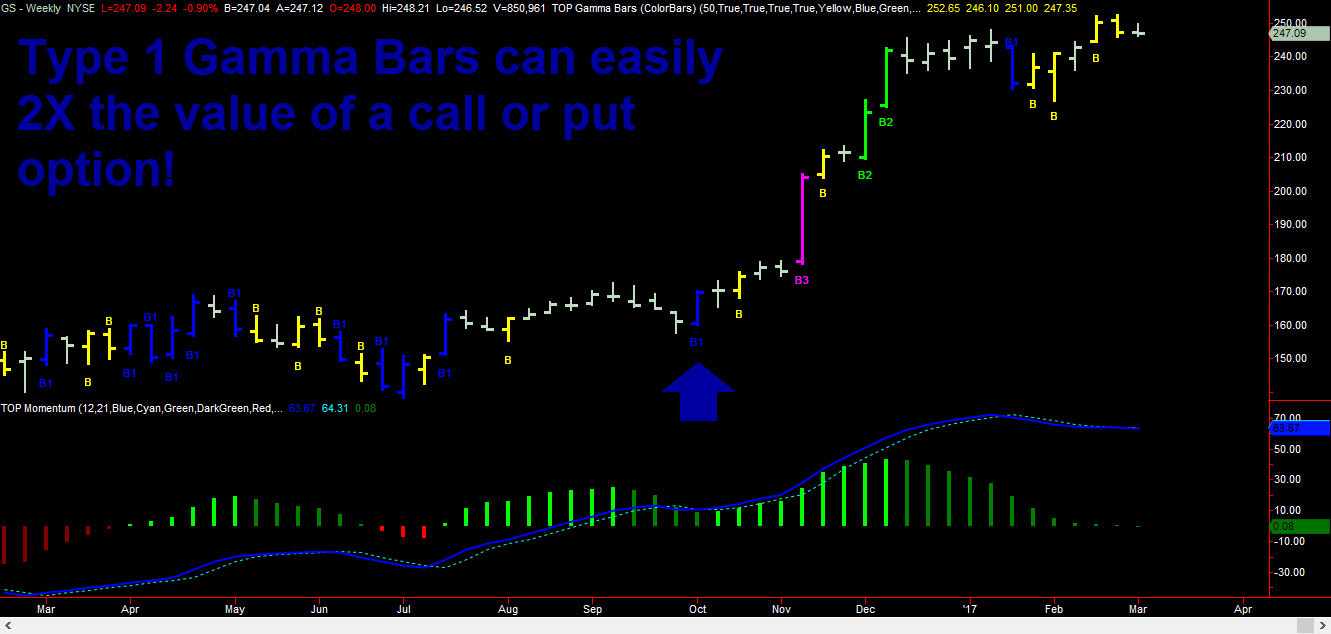
Type 1 Gamma BarsTM are generally very profitable and can easily increase the value of a call or put option by 150% or more. When trading Gamma BarsTM for any market, your primary objective is to correctly forecast Type 1 Gamma BarsTM because they are more common than Type 2 and Type 3 Gamma BarsTM.
Type 2 Gamma BarTM
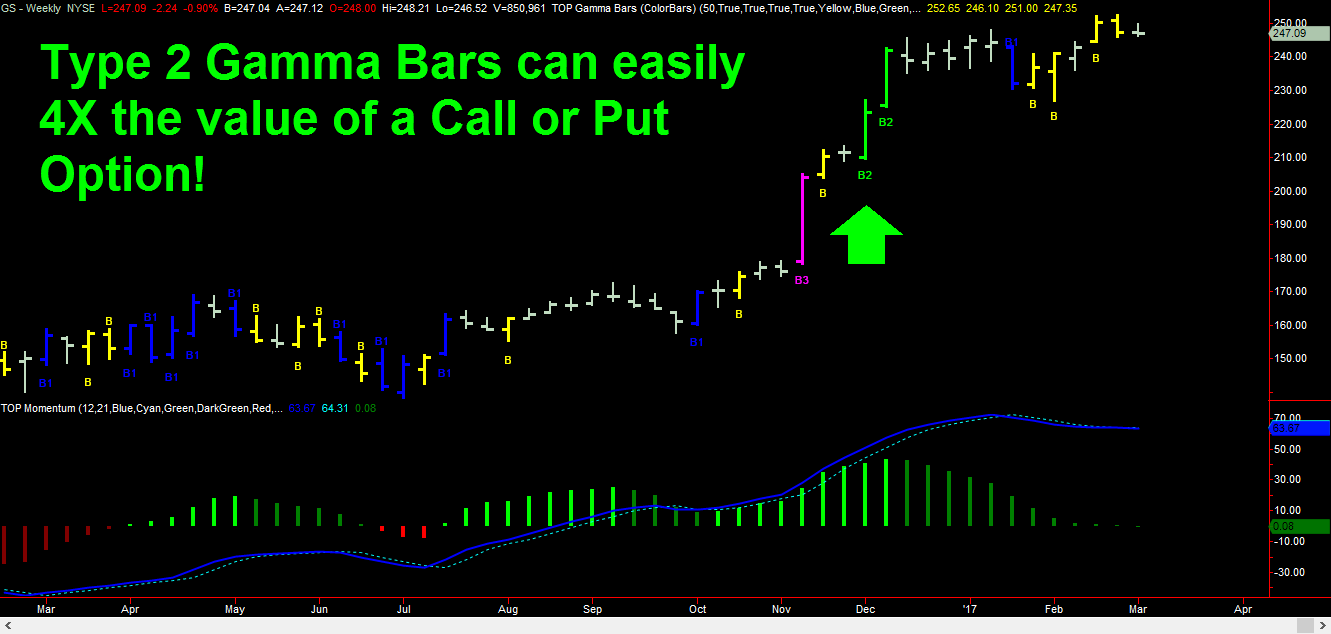
Type 2 Gamma BarsTM, like the one identified in the Goldman Sachs chart above, can 4X or more the value of a call or put option. You can find Type 2 Gamma BarsTM during strong weekly price swings. If you correctly forecast a Type 2 Gamma BarTM, then you will most likely experience significant profits with your long options.
Type 3 Gamma BarTM
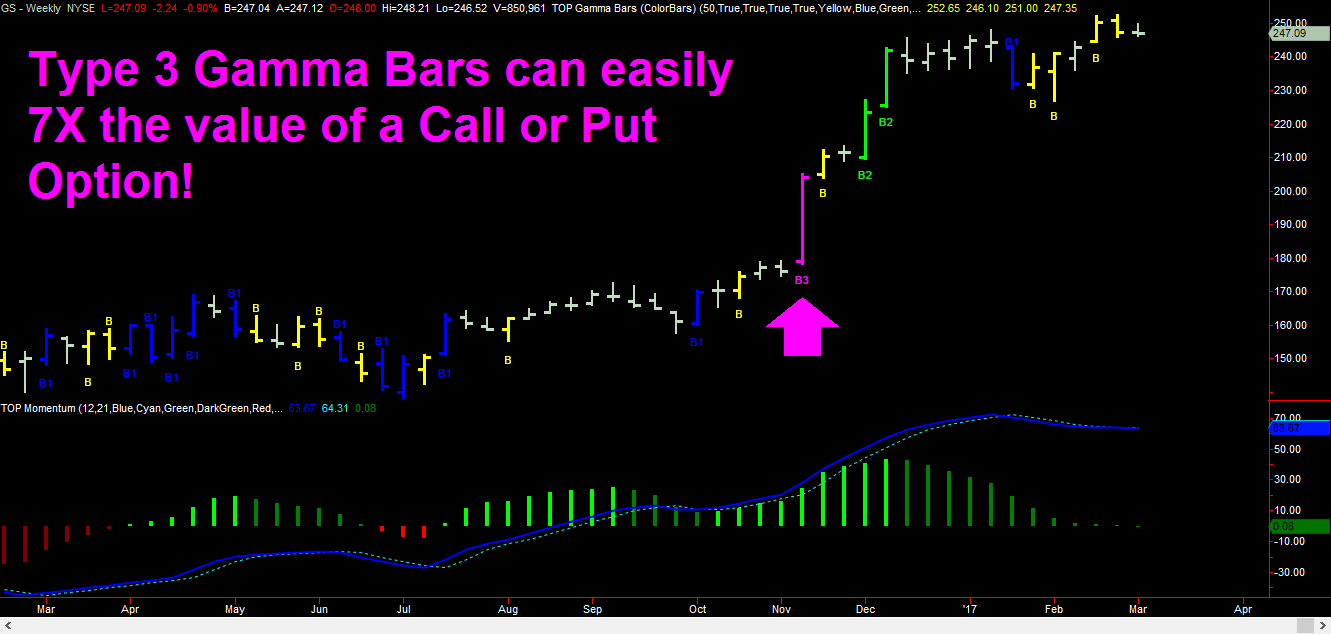
Type 3 Gamma BarsTM, the most profitable type of Gamma BarsTM, can potentially 7X or more the value of an option within a single week! These are relatively rare Gamma BarsTM, but they do occur. If you trade Gamma BarsTM for a period of time and if you learn the types of patterns that these Gamma BarsTM can follow, then you may eventually profit from one of these special profit opportunities.
Gamma BarsTM Trading Strategies
Simply put, the best way to trade Gamma BarsTM is to seek to identify these high energy weekly price bars from high probability trade setups on weekly or monthly price charts or by relying on probability strategies. Think in terms of working to find clusters or groups of either bullish or bearish Gamma BarsTM within weekly price swings or moves.
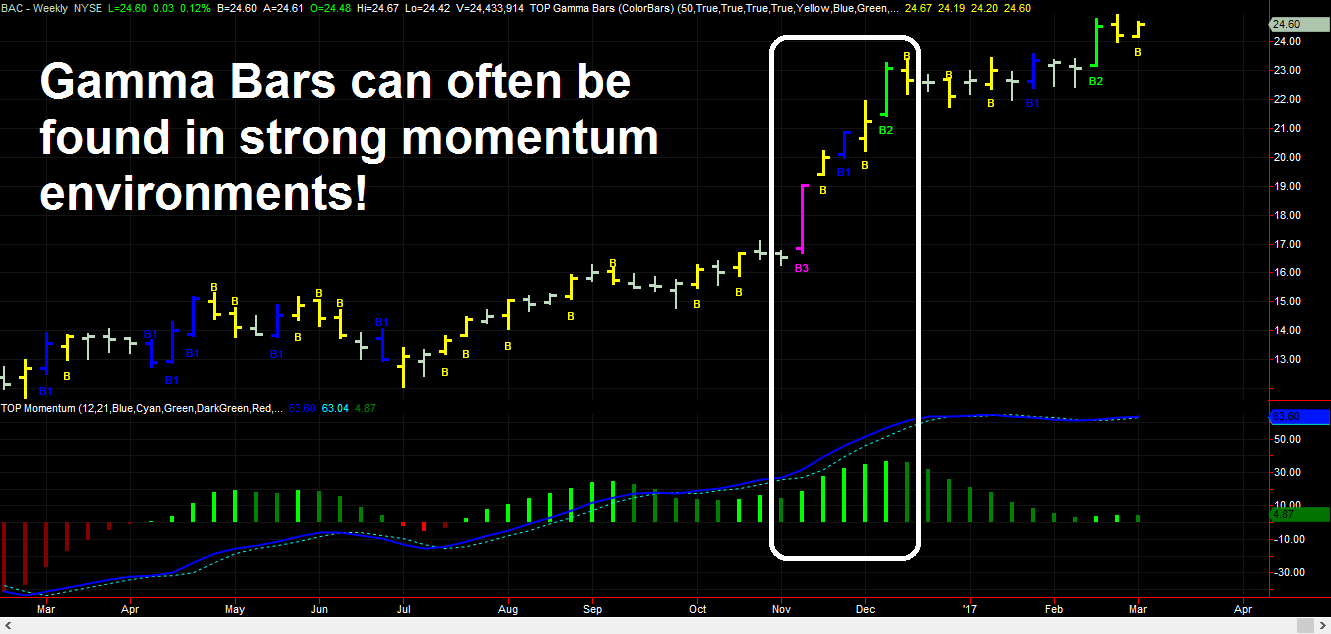
In the weekly Bank of America (BAC) chart above, a bullish Gamma BarTM cluster occurred during a strong upward momentum period. The four individual types of Gamma BarsTM were contained within this strong momentum period. Gamma BarsTM clusters like this can be highly profitable.
Disclaimer: There is a risk in trading options and past performance is not necessarily indicative of future results.
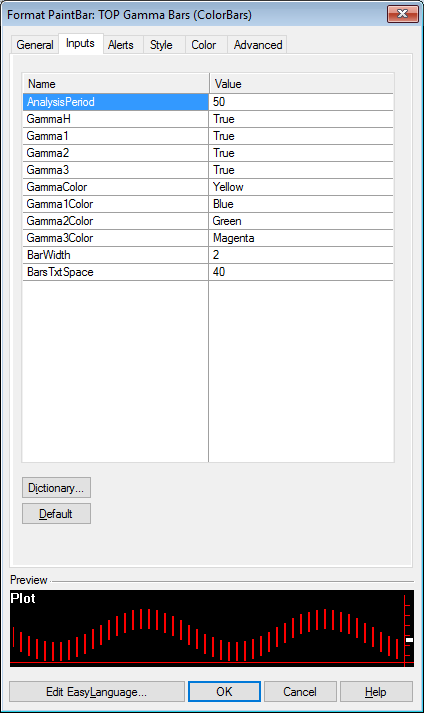
Gamma BarsTM Indicator Parameters
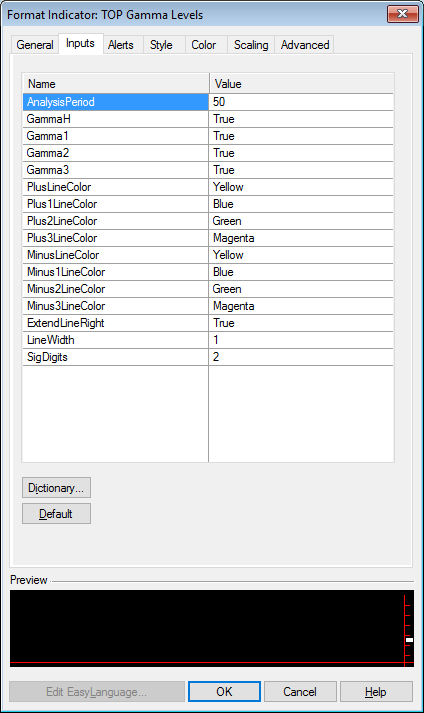
We have designed the TOP Gamma BarsTM indicator to be both powerful and easy to use. We recommend using our default parameter settings. However, you can modify and customize this indicator as you see fit. The AnalysisPeriod parameter defines the period for our volatility analysis used to define the different types of Gamma BarsTM. The GammaH (Fractional Gamma BarTM), Gamma1, Gamma2, and Gamma3 parameters allow traders to turn on and display (True) or turn off and hide (False) the display for each type of Gamma BarTM. Gamma Color parameters allow users to set the colors for each type of Gamma BarTM. The BarWidth parameter defines the thickness of Gamma BarTM colorbars and the BarsTxtSpace defines the distance that labels are positioned above or below price bars.
Get the TOP Gamma BarsTM Advantage Today!
Both new traders and professional traders alike can benefit from the power of the TOP Gamma BarsTM indicator for trading weekly options. The TOP Gamma BarsTM indicator can be used to trade options on stocks, ETFs, futures, and forex. Now you can identify high energy Gamma BarsTM for options on markets you trade using the TOP Gamma BarsTM indicator. Get the TOP Gamma BarsTM advantage today by clicking the button below!
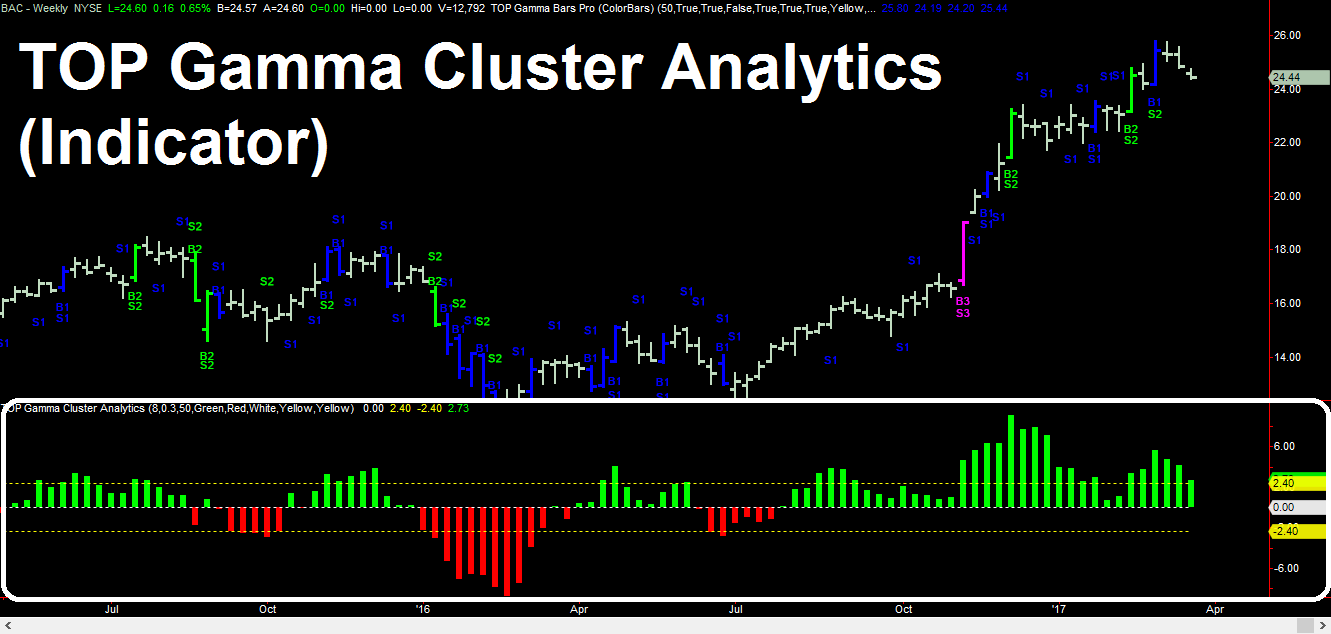
TOP Gamma Cluster AnalyticsTM Indicator
for Trading Options with the Gamma BarsTM Strategy
Gamma BarsTM – The Hottest New Way to Trade Weekly Options
This write-up is intended to describe the TOP Gamma Cluster AnalyticsTM indicator. If you are not familiar with the Gamma BarsTM trading strategy, then be sure to visit 3xOptions.com, home of Gamma BarsTM trading, for more information about the hottest new way to trade weekly options using Gamma BarsTM.
Displays Potentially Profitable Gamma BarTM Clusters
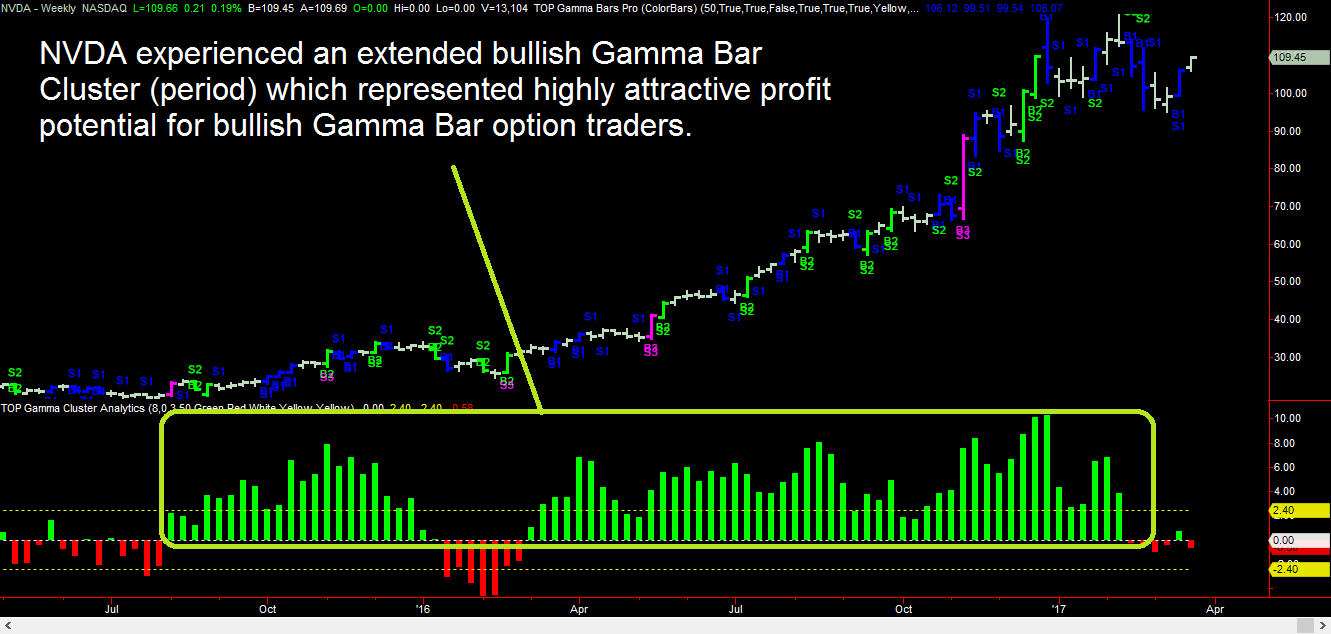
The Gamma Cluster AnalyticsTM indicator is designed to display periods that are likely to include potentially highly profitable bullish or bearish Gamma BarTM Clusters.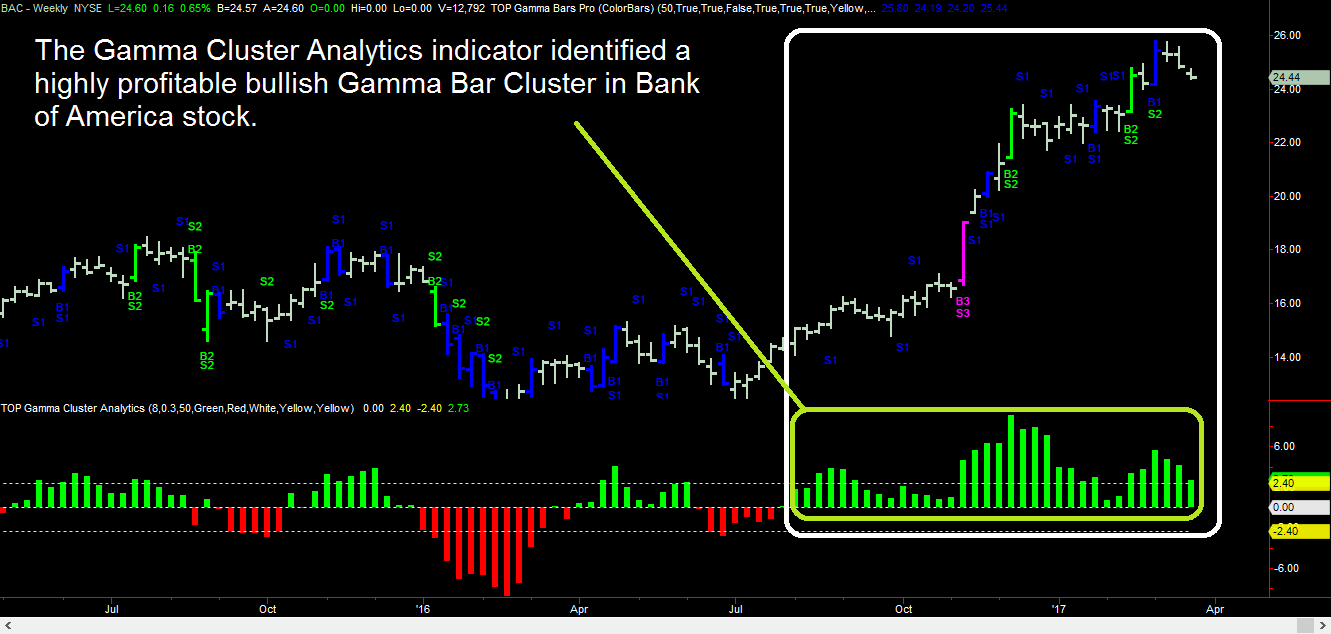
Gamma Cluster AnalyticsTM Indicator Parameters
We have designed the TOP Gamma Cluster AnalyticsTM indicator to be both powerful and easy to use. We recommend using our default parameter settings. However, you can modify and customize this indicator as you see fit. The SwingPeriod parameter focuses on a target bar count (half cycle period) for a bullish or bearish Gamma BarTM Cluster. The Decay parameter is designed to represent the drag (long option value decrease for each one week period) that time decay can represent against Gamma BarTM profits. The AnalysisPeriod parameter defines the period for our volatility analysis used to define the different types of Gamma BarsTM. The remaining color parameters allow users to set the indicator colors.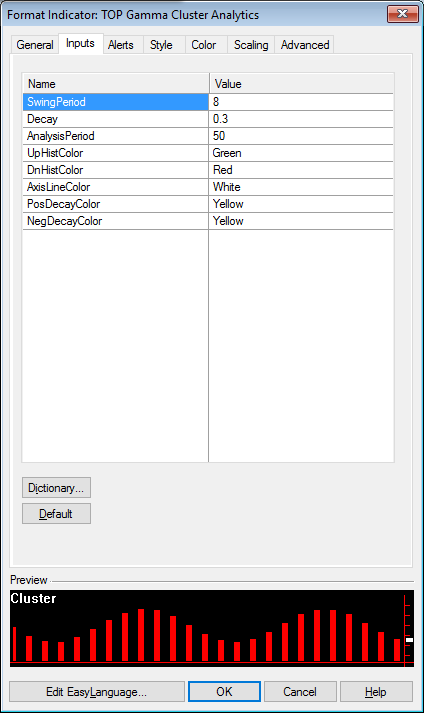
Get the TOP Gamma Cluster AnalyticsTM Advantage Today!
Both new traders and professional traders alike can benefit from the power of the TOP Gamma Cluster AnalyticsTM indicator for trading weekly options. The TOP Gamma Cluster AnalyticsTM indicator can be used to trade options on stocks, ETFs, futures, and forex. Now you can identify high energy Gamma BarTM Clusters where potentially profitable bullish or bearish Gamma BarsTM are likely to develop. Get the TOP Gamma Cluster AnalyticsTM advantage today by clicking the button below!TOP Gamma DisparityTM Indicator
for Trading Options with the Gamma BarsTM Strategy
Gamma BarsTM – The Hottest New Way to Trade Weekly Options
This write-up is intended to describe the TOP Gamma DisparityTM indicator. If you are not familiar with the Gamma BarsTM trading strategy, then be sure to visit TopTradeTools.com, home of Gamma BarsTM trading, for more information about the hottest new way to trade weekly options using Gamma BarsTM.
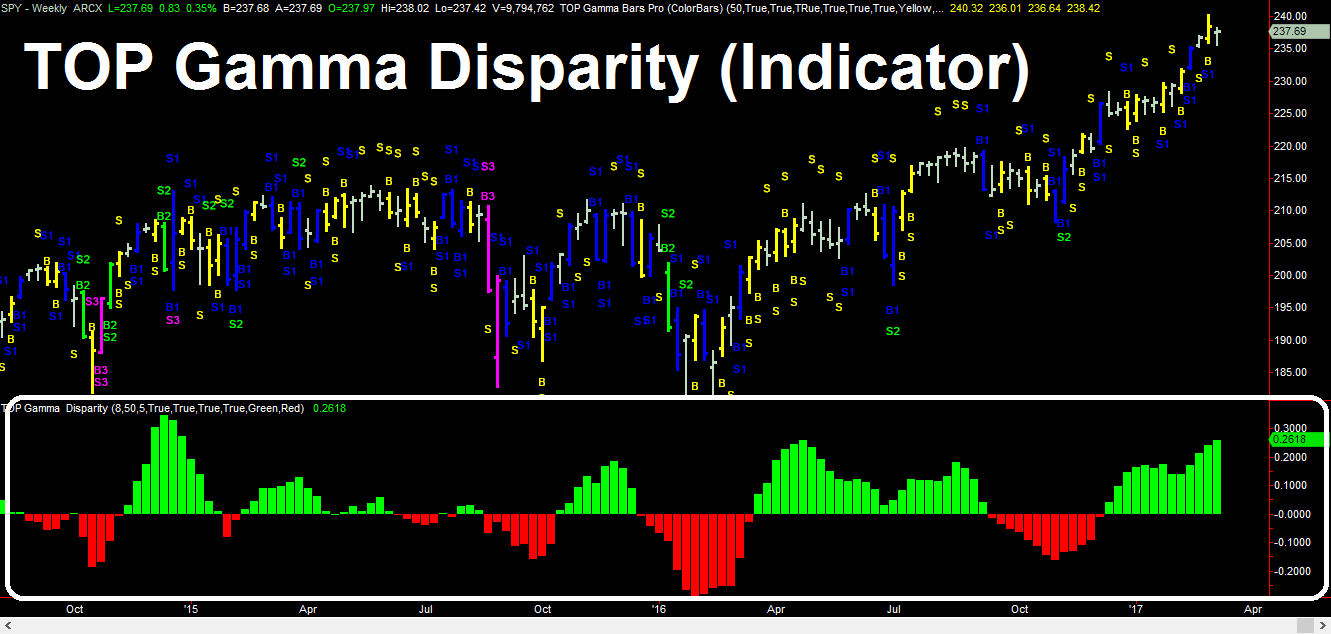
Displays Changing Gamma BarTM Strength
The Gamma DisparityTM indicator is designed to display the relative strength of Gamma BarsTM over time, which allows you to see if more or fewer bullish and bearish Gamma BarsTM are likely to develop in a particular market.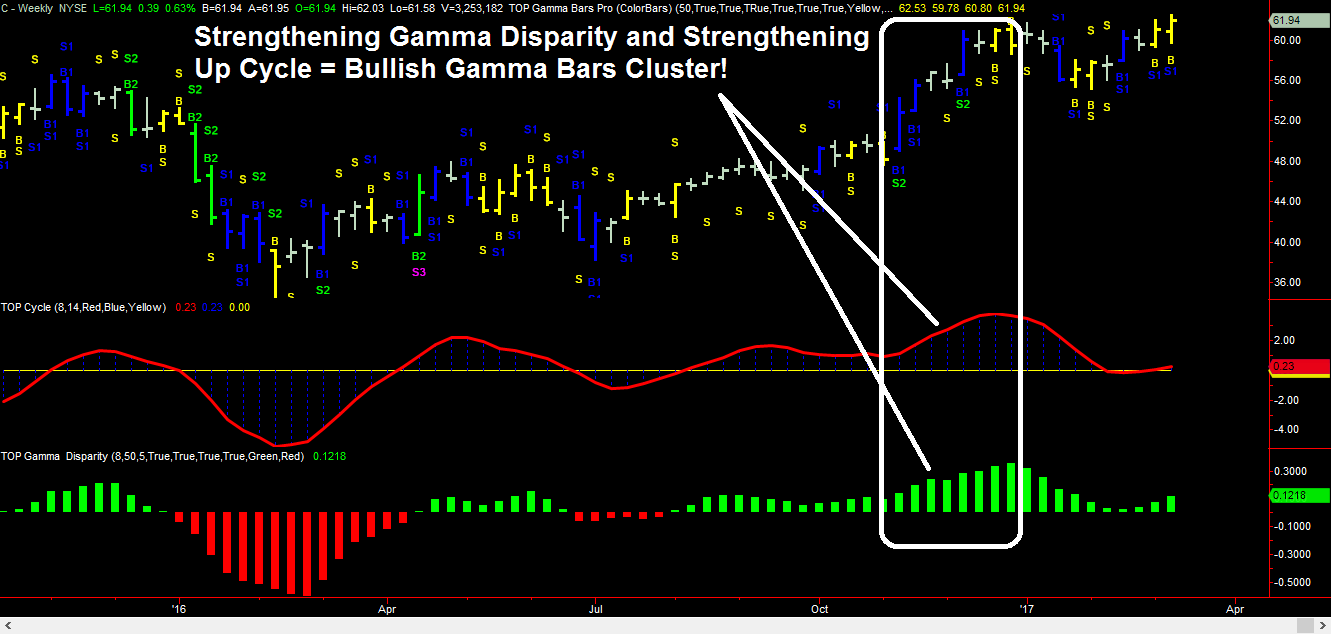
Gamma DisparityTM Indicator Parameters
We have designed the TOP Gamma DisparityTM indicator to be both powerful and easy to use. We recommend using our default parameter settings. However, you can modify and customize this indicator as you see fit. The SwingPeriod parameter focuses on a target bar count (half cycle period) for either an average upcycle or down cycle. The AnalysisPeriod parameter defines the period for our volatility analysis used to define the different types of Gamma BarsTM. AvgLength is a parameter that defines a smoothing formula for the indicator. The GammaH (Fractional Gamma BarTM), Gamma1, Gamma2, and Gamma3 parameters allow traders to turn on and display (True) or turn off and hide (False) the display for each type of Gamma BarTM. Gamma Color parameters allow users to set the indicator colors.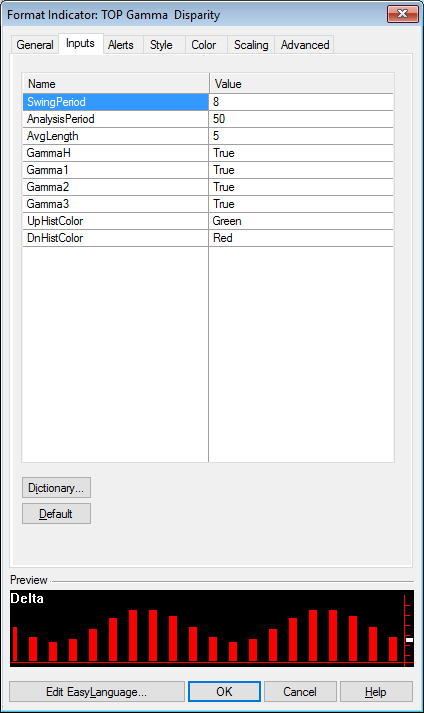
Get the TOP Gamma DisparityTM Advantage Today!
Both new traders and professional traders alike can benefit from the power of the TOP Gamma DisparityTM indicator for trading weekly options. The TOP Gamma DisparityTM indicator can be used to trade options on stocks, ETFs, futures, and forex. Now you can identify the changing strength of Gamma BarsTM over time to identify strong period with good trading opportunities along with periods that should not be traded. Get the TOP Gamma DisparityTM advantage today by clicking the button below!TOP Gamma FrequencyTM Indicator
for Trading Options with the Gamma BarsTM Strategy
Gamma BarsTM – The Hottest New Way to Trade Weekly Options
This write-up is intended to describe the TOP Gamma FrequencyTM indicator. If you are not familiar with the Gamma BarsTM trading strategy, then be sure to visit TopTradeTools.com, home of Gamma BarsTM trading, for more information about the hottest new way to trade weekly options using Gamma BarsTM.
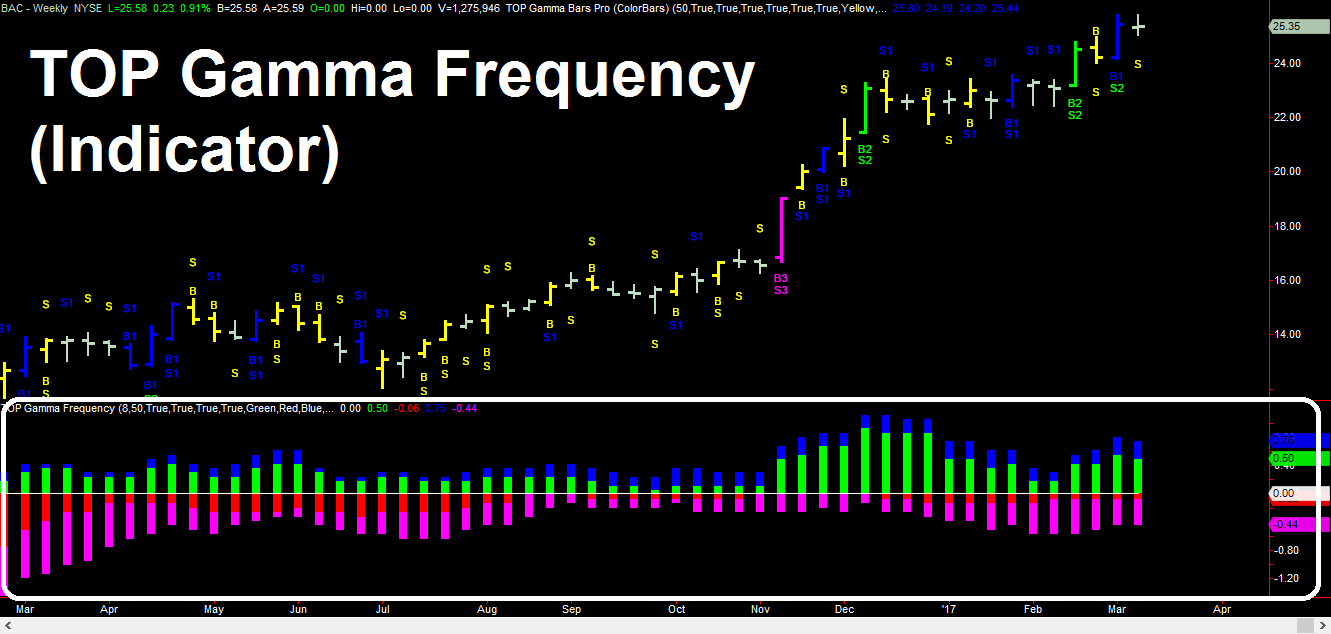
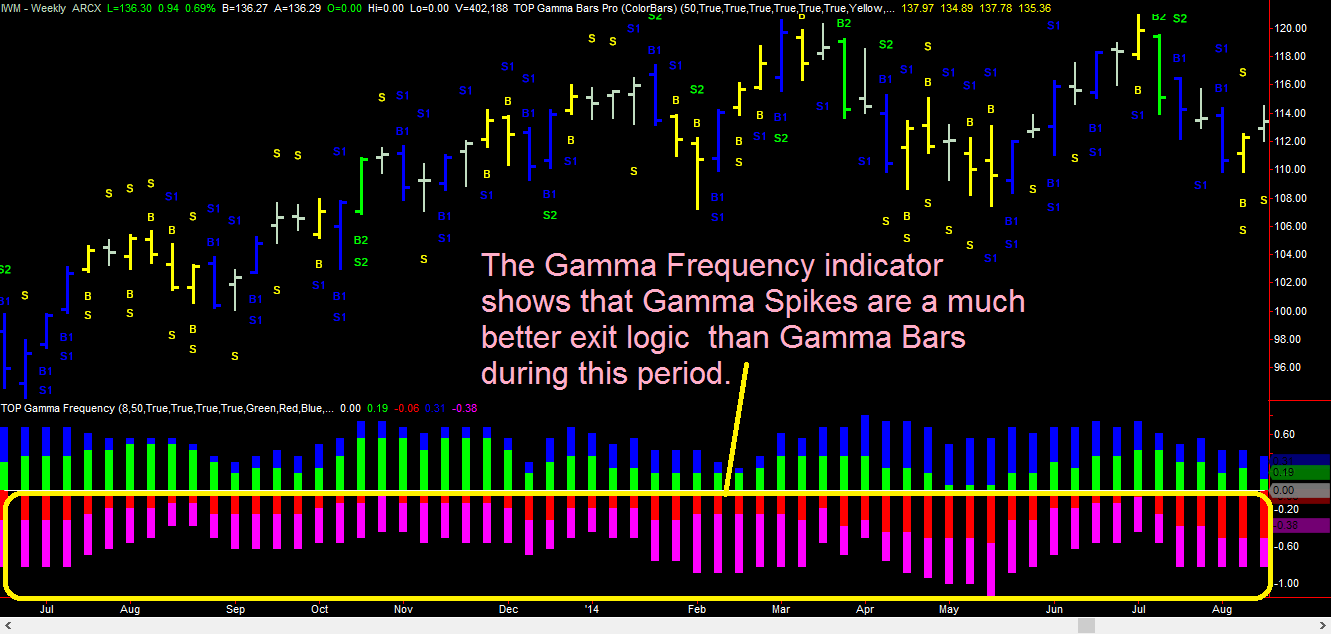
Displays Powerful Gamma BarsTM to Gamma SpikesTM Ratio
The Gamma FrequencyTM indicator is designed to display powerful Gamma BarsTM and Gamma SpikesTM information that communicates the ratio between Gamma BarsTM to Gamma SpikesTM, which can be used to determine Gamma trade exit preferences.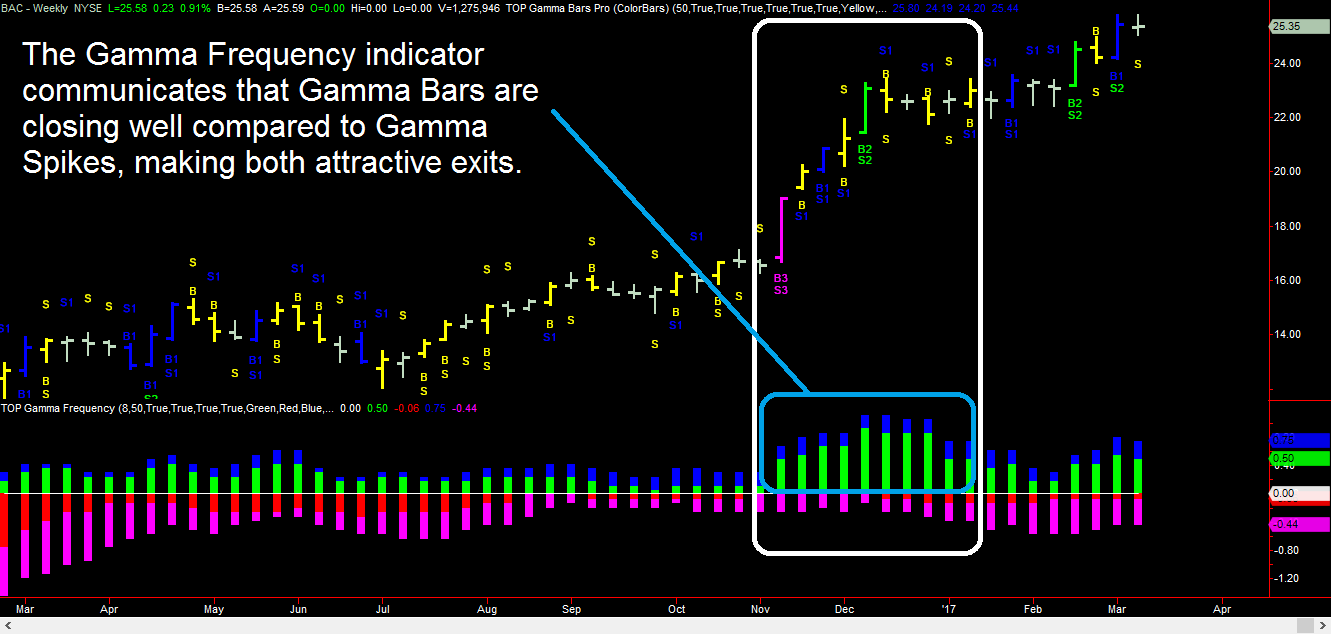
Gamma FrequencyTM Indicator Parameters
We have designed the TOP Gamma FrequencyTM indicator to be both powerful and easy to use. We recommend using our default parameter settings. However, you can modify and customize this indicator as you see fit. The SwingPeriod parameter focuses on a target bar count (half cycle period) for either an average upcycle or down cycle. The AnalysisPeriod parameter defines the period for our volatility analysis used to define the different types of Gamma BarsTM. The GammaH (Fractional Gamma BarTM), Gamma1, Gamma2, and Gamma3 parameters allow traders to turn on and display (True) or turn off and hide (False) the display for each type of Gamma BarTM. Gamma Color parameters allow users to set the indicator colors.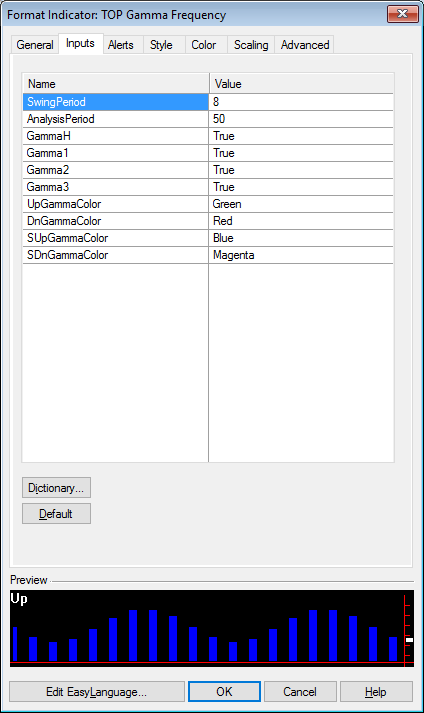
Get the TOP Gamma FrequencyTM Advantage Today!
Both new traders and professional traders alike can benefit from the power of the TOP Gamma FrequencyTM indicator for trading weekly options. The TOP Gamma FrequencyTM indicator can be used to trade options on stocks, ETFs, futures, and forex. Now you can identify high energy Gamma BarsTM relative to Gamma SpikesTM in an indicator subplot using the TOP Gamma FrequencyTM indicator, which can help you select your optimal Gamma option exit logic. Get the TOP Gamma FrequencyTM advantage today by clicking the button below!TOP Gamma HistogramTM Indicator
for Trading Options with the Gamma BarsTM Strategy
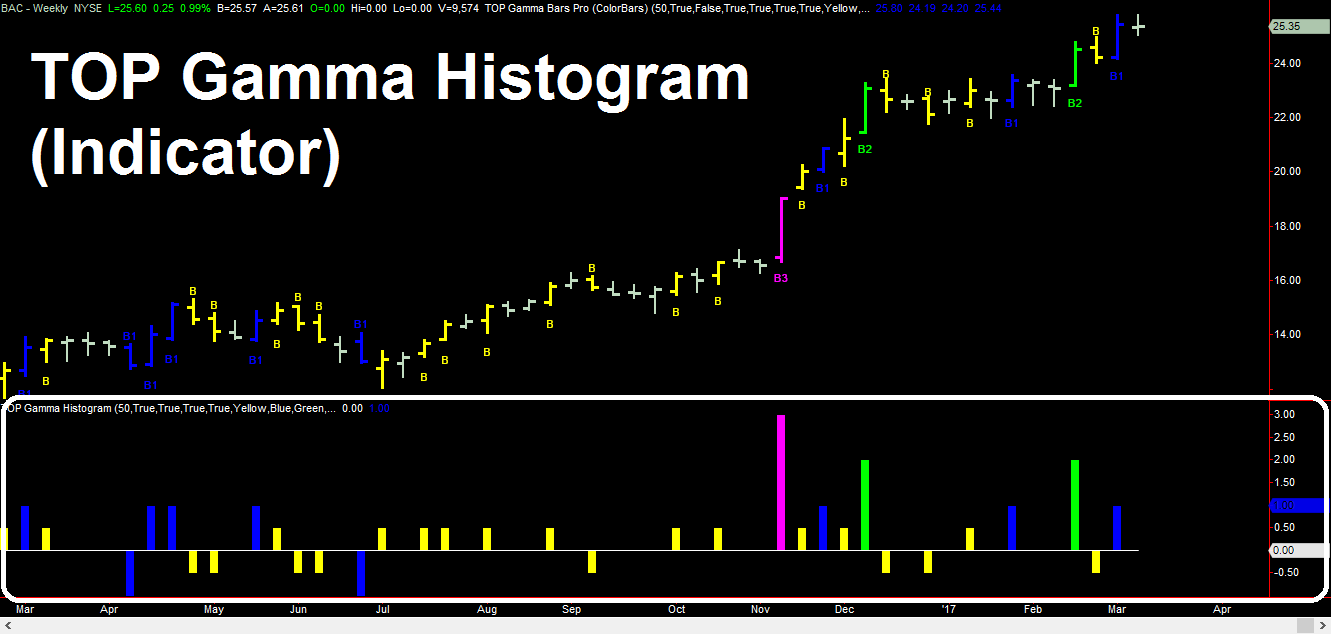
Gamma BarsTM – The Hottest New Way to Trade Weekly Options
This write-up is intended to describe the TOP Gamma HistogramTM indicator. If you are not familiar with the Gamma BarsTM trading strategy, then be sure to visit TopTradeTools.com, home of Gamma BarsTM trading, for more information about the hottest new way to trade weekly options using Gamma BarsTM.
High Energy Gamma BarTM Types
In order to help you use the Gamma HistogramTM indicator more effectively, we included a brief description of the types of Gamma BarsTM below. Gamma BarsTM can be bullish or bearish. Bullish Gamma BarsTM will have labels positioned below the Gamma BarsTM and bearish Gamma BarsTM will have labels positioned above the Gamma BarsTM (reference the BAC chart above to see examples of mostly Bullish Gamma BarsTM). The different colors of the Gamma BarsTM distinguish the four different types, or magnitudes, of Gamma BarsTM. The four principal types of Gamma BarsTM include:Types of Gamma BarsTM (from Weakest to Strongest)
Fractional Gamma Bars (Yellow “B”) Type 1 Gamma Bars (Blue “B1”) Type 2 Gamma Bars (Green “B2”) Type 3 Gamma Bars (Magenta “B3”)Fractional Gamma BarTM
Type 1 Gamma BarTM
Type 2 Gamma BarTM
Type 3 Gamma BarTM
Gamma HistogramTM Indicator Parameters
We have designed the TOP Gamma HistogramTM indicator to be both powerful and easy to use. We recommend using our default parameter settings. However, you can modify and customize this indicator as you see fit. The AnalysisPeriod parameter defines the period for our volatility analysis used to define the different types of Gamma BarsTM. The GammaH (Fractional Gamma BarTM), Gamma1, Gamma2, and Gamma3 parameters allow traders to turn on and display (True) or turn off and hide (False) the display for each type of Gamma BarTM. Gamma Color parameters allow users to set the colors for each Gamma HistogramTM or the axis line.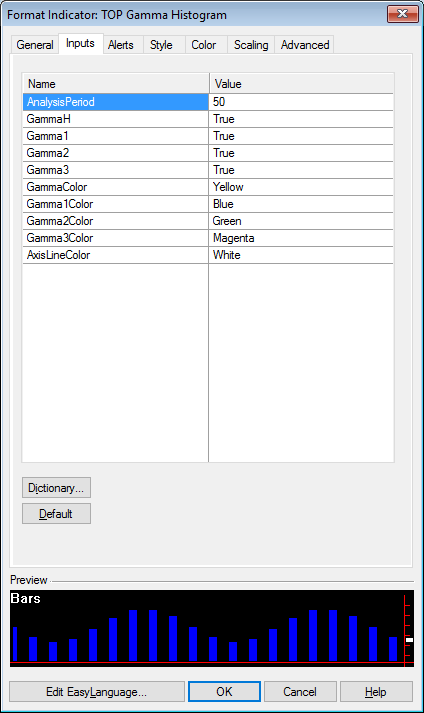
Get the TOP Gamma HistogramTM Advantage Today!
Both new traders and professional traders alike can benefit from the power of the TOP Gamma HistogramTM indicator for trading weekly options. The TOP Gamma HistogramTM indicator can be used to trade options on stocks, ETFs, futures, and forex. Now you can identify high energy Gamma BarsTM in an indicator subplot using the TOP Gamma HistogramTM indicator. Get the TOP Gamma HistogramTM advantage today by clicking the button below!TOP Gamma LevelsTM Indicator
for Trading Options with the Gamma BarsTM Strategy
Gamma BarsTM – The Hottest New Way to Trade Weekly Options
This write-up is intended to describe the TOP Gamma LevelsTM indicator. If you are not familiar with the Gamma BarsTM trading strategy, then be sure to visit TopTradeTools.com, home of Gamma BarsTM trading, for more information about the hottest new way to trade weekly options using Gamma BarsTM.
High Energy Gamma BarTM Types
In order to help you use the Gamma LevelsTM indicator more effectively, we included a brief description of the types of Gamma BarsTM below. Gamma BarsTM can be bullish or bearish. Bullish Gamma BarsTM will have labels positioned below the Gamma BarsTM and bearish Gamma BarsTM will have labels positioned above the Gamma BarsTM (reference the BAC chart above to see examples of mostly Bullish Gamma BarsTM). The different colors of the Gamma BarsTM distinguish the four different types, or magnitudes, of Gamma BarsTM. The four principal types of Gamma BarsTM include:Types of Gamma BarsTM (from Weakest to Strongest)
Fractional Gamma Bars (Yellow “B”) Type 1 Gamma Bars (Blue “B1”) Type 2 Gamma Bars (Green “B2”) Type 3 Gamma Bars (Magenta “B3”)Fractional Gamma BarTM
Type 1 Gamma BarTM
Type 2 Gamma BarTM
Type 3 Gamma BarTM
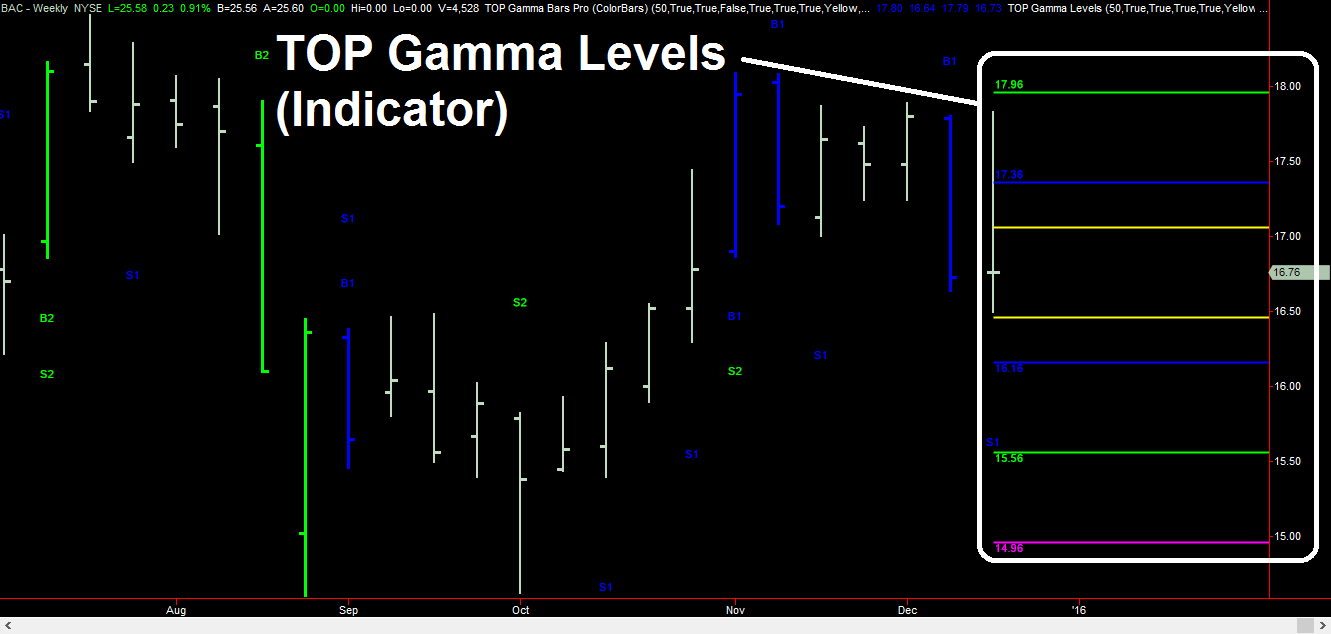
Gamma LevelsTM Indicator Parameters
We have designed the TOP Gamma LevelsTM indicator to be both powerful and easy to use. We recommend using our default parameter settings. However, you can modify and customize this indicator as you see fit. The AnalysisPeriod parameter defines the period for our volatility analysis used to define the different types of Gamma BarsTM. The GammaH (Fractional Gamma BarTM), Gamma1, Gamma2, and Gamma3 parameters allow traders to turn on and display (True) or turn off and hide (False) the display for each type of Gamma BarTM. Gamma Color parameters allow users to set the colors for each Gamma LevelsTM profit target line. The LineWidth parameter defines the thickness of Gamma LevelsTM lines and the SigDigits defines the number of digits on Gamma LevelsTM line labels.