TOP Cycle Indicator
with Colored Histogram Overlay
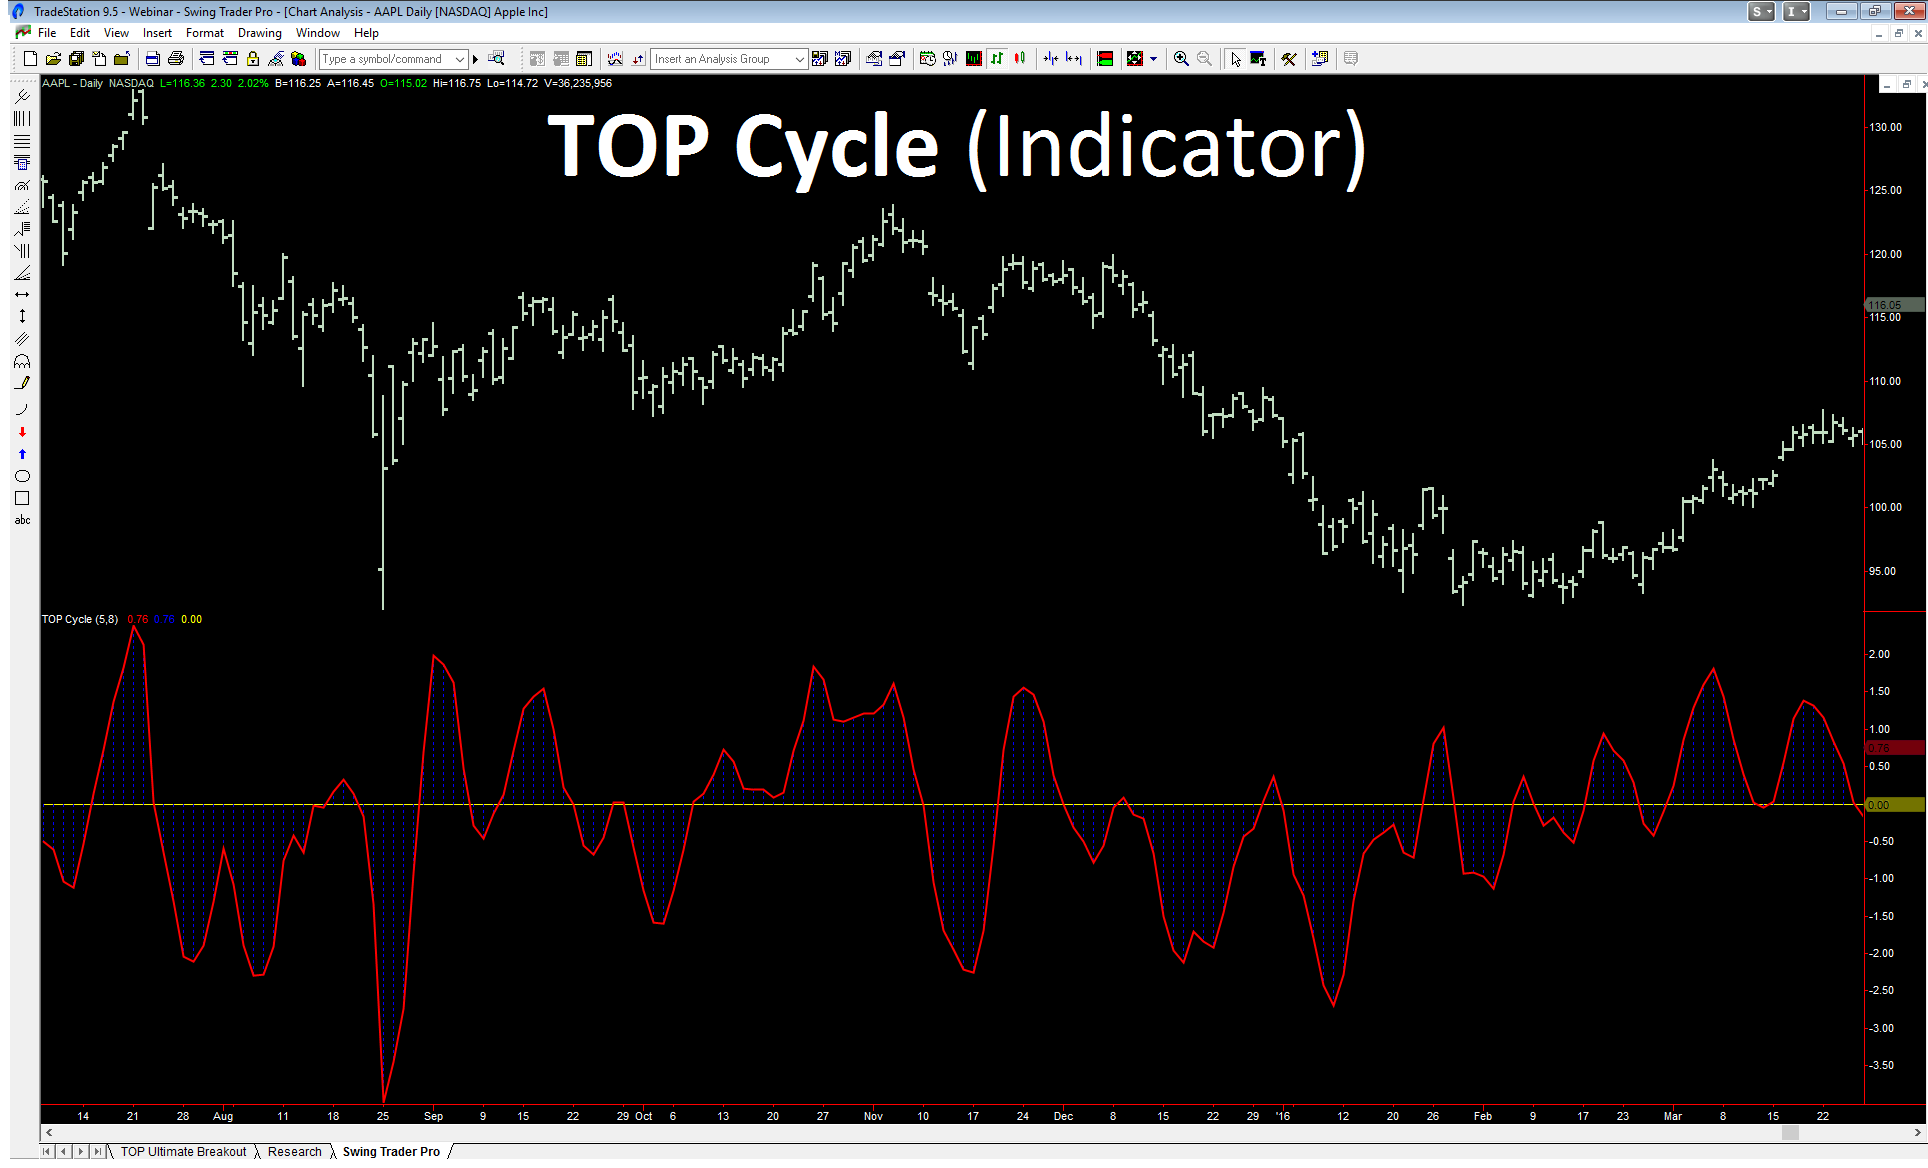

In the daily Apple chart above, you can see how effectively the TOP Cycle indicator was able to identify AAPL daily cycle bottoms. After you learn how to optimize the TOP Cycle parameters to the dominant cycle in any market, you have the potential to effectively identify cycle tops and cycle bottoms when they occur, which can be very helpful in forecasting future price moves and achieving profitability in your trading.
Cycle Forecast Based Trade Setups
Calibrating the TOP Cycle indicator to the dominant cycle action for any market and timeframe is easy to learn. The TOP Cycle indicator has two parameter settings that you can adjust to find the dominant cycle action for any market you trade. Once you find the dominant price cycle, the TOP Cycle indicator can be a powerful tool to exploit cycle based trade setups.
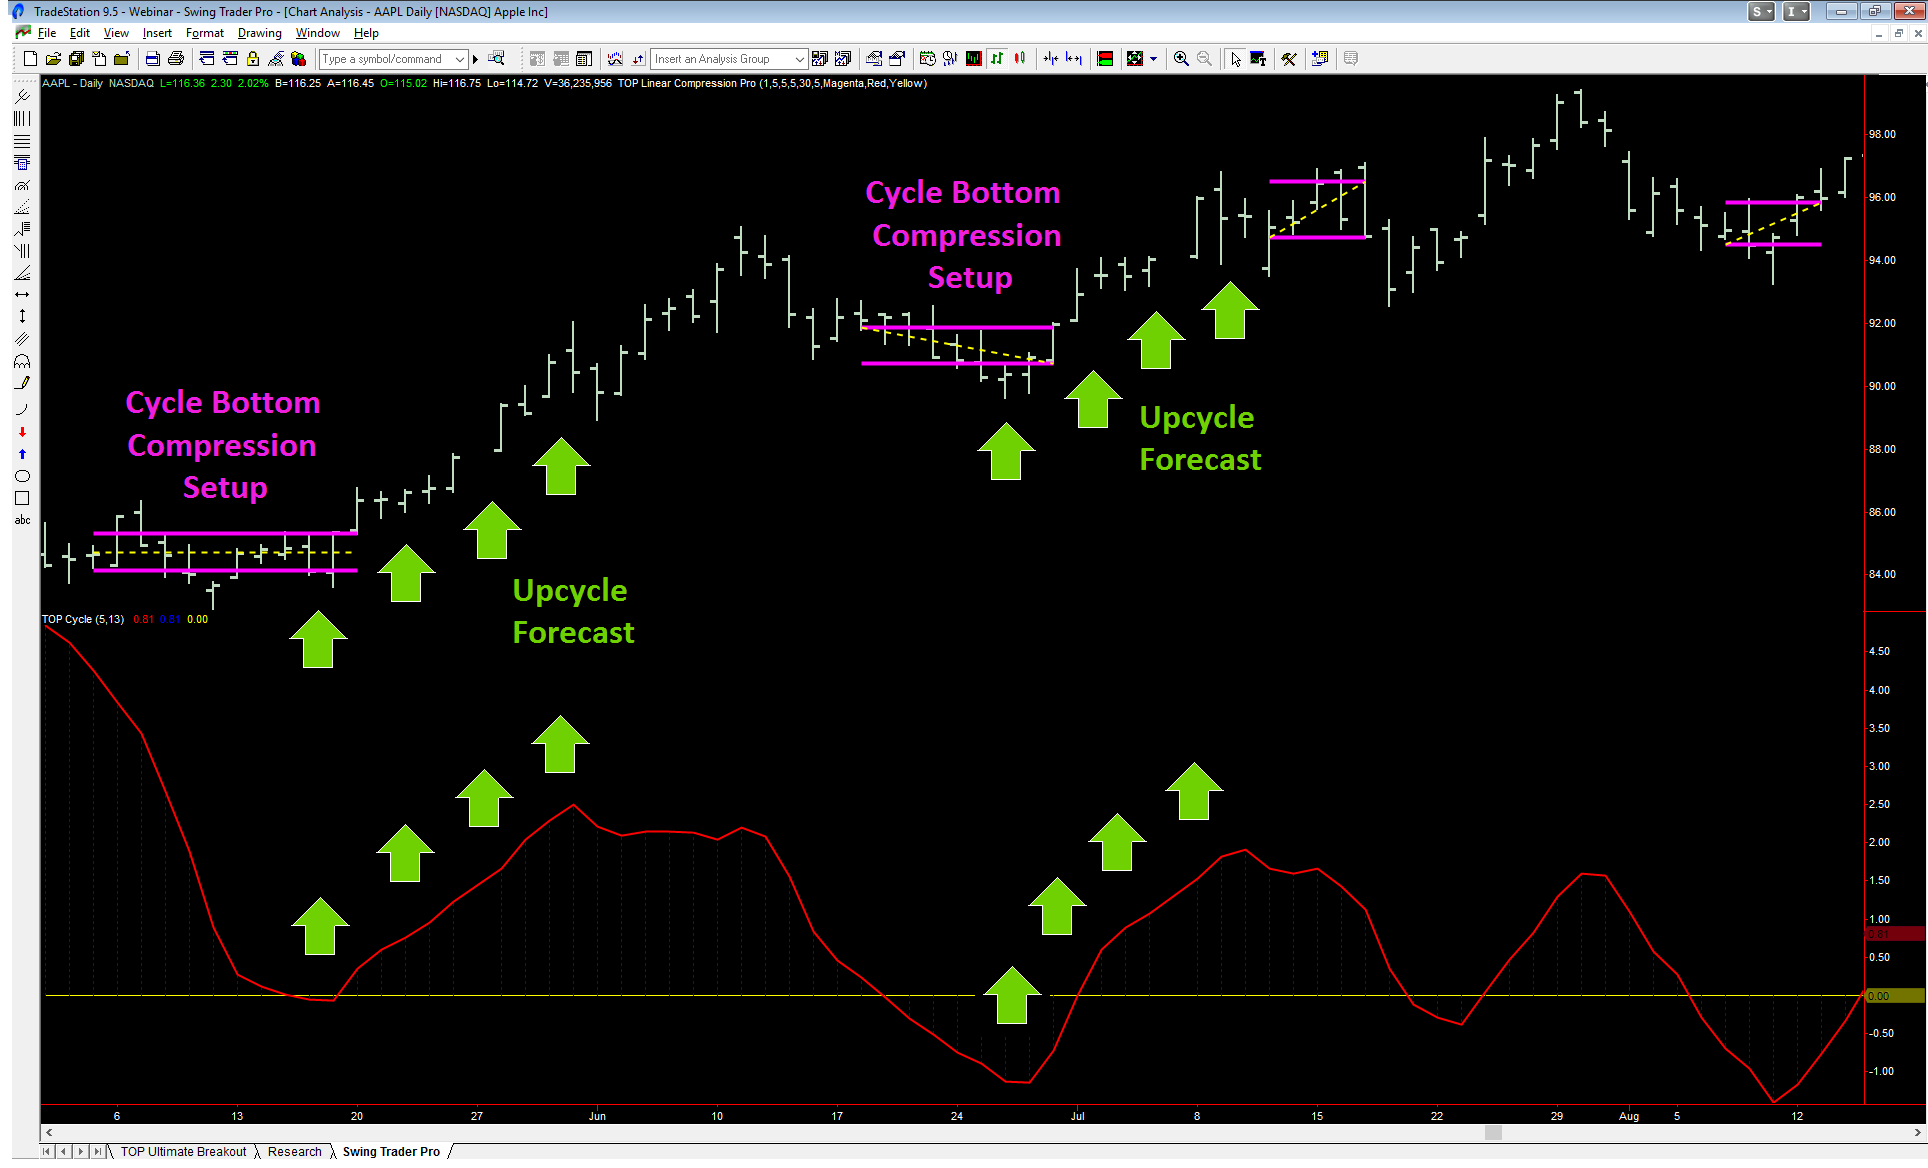
In the daily Apple chart above, the TOP Cycle indicator effectively identified several key daily cycle bottoms. Combining this powerful timing information with volatility compressions identified by the TOP Linear Compression Pro, you can potentially increase the strength of a trade setup forecast confluence – the predictive power of combining more than one trade setup.
Using a Strategy with TOP Cycle Forecasts
Once the TOP Cycle indicator has been calibrated to the dominate cycle in the market and timeframe you are analyzing, you can potentially increase the probability of a profitable outcome of your buy signals if you are forecasting an up cycle. Similarly, you can increase the probability of a profitable outcome of your sell signals if you are forecasting a down cycle.
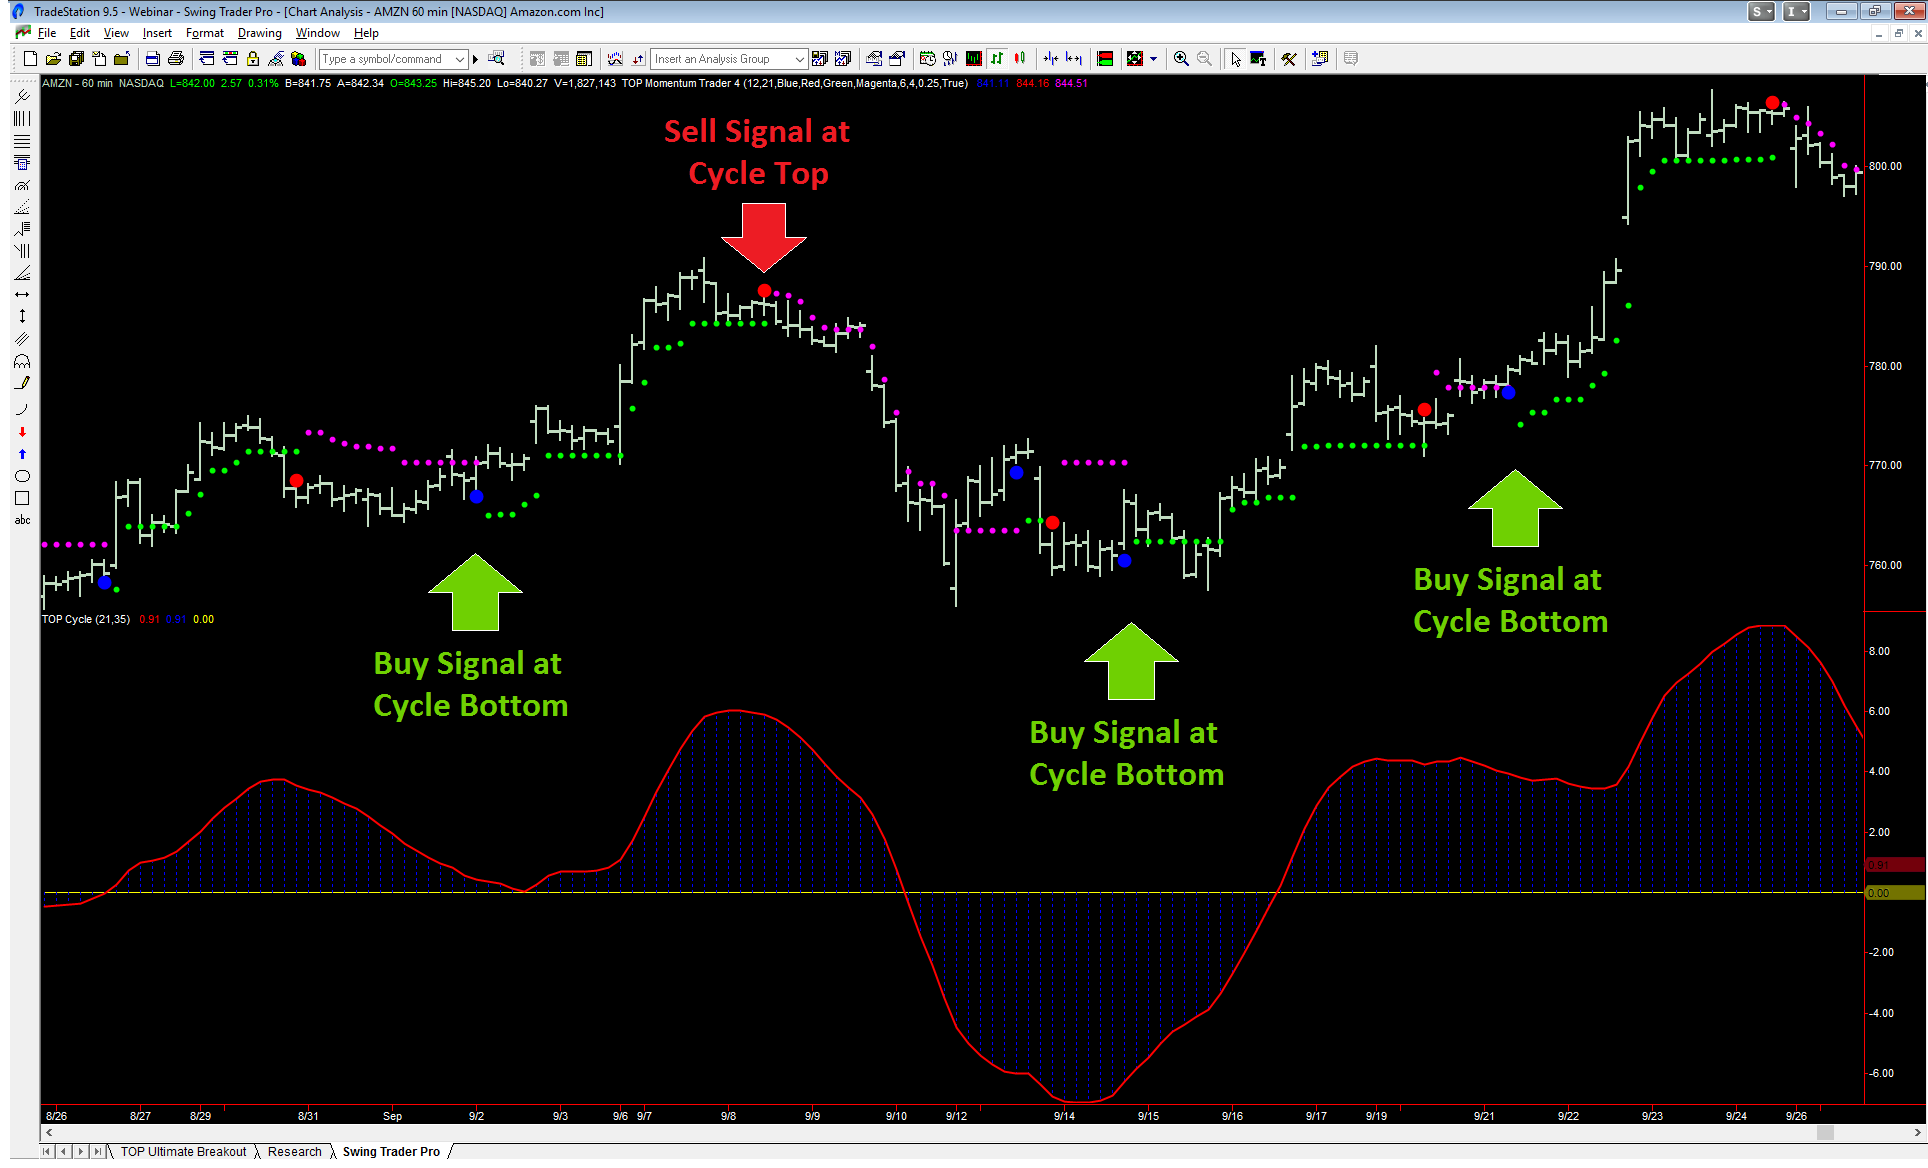
You can see in the above 60 minute chart of AMZN (above) that several profitable trades were identified because the TOP Cycle indicator was able to accurately identify cycle lows (bottoms) and cycle highs (tops). Given sufficient price volatility, buy signals taken at cycle bottoms tend to have a higher probability for success. On the flip side, sell signals taken at cycle tops tend to have a higher probability for success.
Simple Indicator Settings
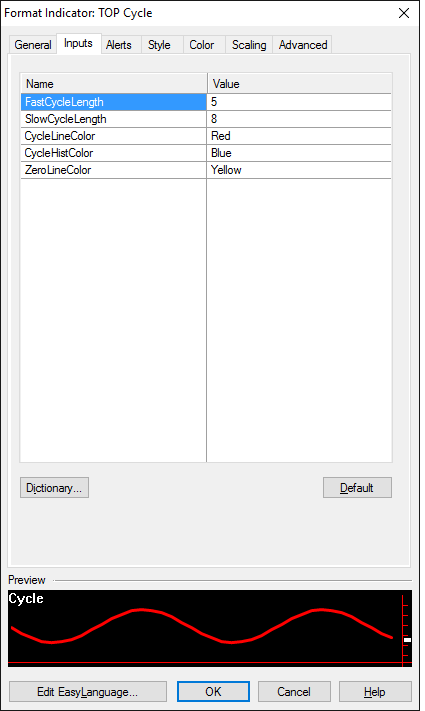
We have designed the TOP Cycle indicator to be both powerful and easy to use. Our default settings represent our recommended settings. However, if you wish, you can adjust the TOP Cycle settings to refine your dominant cycle analysis using your preferred parameter settings.
The TOP Cycle indicator only has two main parameters, which include FastCycleLength and SlowCycleLength. We recommend the following parameter combinations to find the dominant cycle for any market and timeframe you are analyzing:
FastCycleLength(5) and SlowCycleLength(8)
FastCycleLength(8) and SlowCycleLength(13)
FastCycleLength(13) and SlowCycleLength(21)
FastCycleLength(21) and SlowCycleLength(35)
The remaining parameters allow you to select the colors for the TOP Cycle indicator line, histogram, and zero line.
Get the TOP Cycle Advantage Today!
Both new traders and professional traders alike can benefit from the power of the TOP Cycle indicator for day trading, swing trading, and trend trading. The TOP Cycle indicator can be used to trade Stocks, Bonds, ETFs, Options, Futures, FOREX, and CFDs. Now you can learn to find the dominant cycle in any market you trade using the TOP Cycle indicator. Get the TOP Cycle advantage today by clicking the button below!