
TOP BETTS
Breakout Entry Two Target Strategy
Simple, Clear Signals Developed for Trading in Any Market
Now you can track and trade the dominant force between the buyers and the sellers in any market with the TOP BETT Strategy! Simply enter trades when prices cross above or below the lines displayed right on your chart. It doesn’t get any easier than that!
For Stocks, Options, Futures, and FOREX Markets
The TOP BETT Strategy is designed to capture profits from directional price moves in any market, including Stocks, Options, Futures, and FOREX markets. The TOP BETT Strategy is designed to follow the buyers when they’re stronger or follow the sellers then they’re stronger, giving you the advantage of jumping in with the stronger market force!
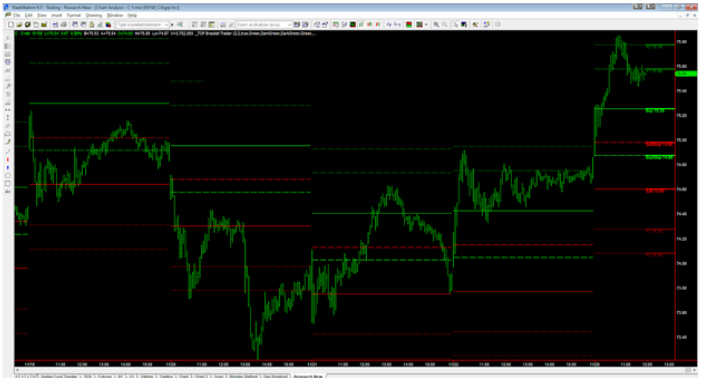
Inspired by Forex Trading Strategies
The TOP BETT Strategy was developed by a friend of Hubert Senters’ who was using it for entering and managing trades in the FOREX markets. Hubert saw how well it was performing in that market and asked if he could use it in other markets. We did our research, followed the original rules for the strategy, and to our surprise it worked for Stocks, Options, and Futures as well. We modified the logic behind the lines to optimize it for the non-forex markets and now it’s available to you!
No More Predicting
Imagine not having to predict where prices are going! One of the most challenging parts of trading is guessing the direction of a market. But now you don’t have to guess the direction of the markets you trade anymore. The TOP BETT Strategy is designed to calculate the Buy and Sell Entries, Stops, and Targets based on our proprietary algorithm at the opening bell each day.
You just wait for the price to hit one of the lines and enter where the BETT Strategy tells you to!
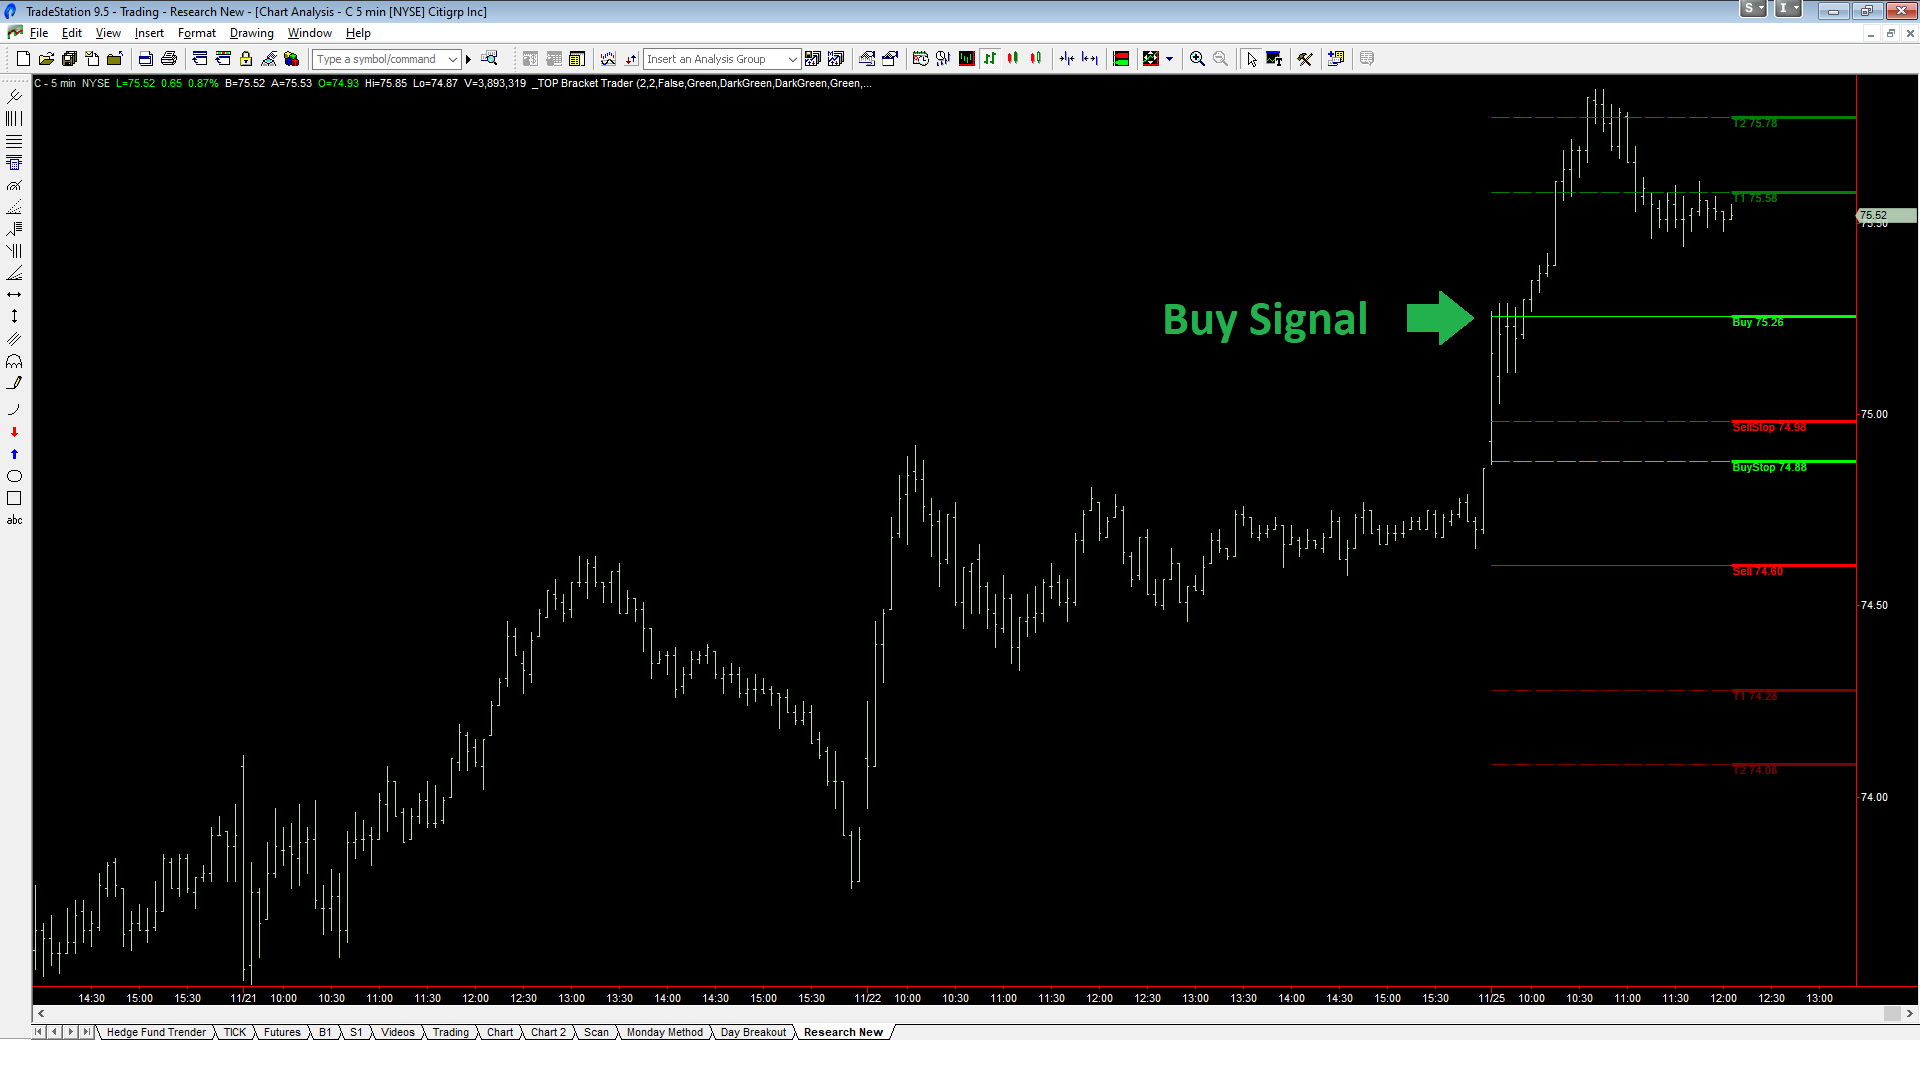
You can see in the above chart of Citigroup (C) that prices moved up quickly. As they cross the green buy line, that’s your signal to buy. You don’t have to wonder when to get in a potential winning trade; the BETT Strategy takes the guesswork out of your trading. And the best part is, that you didn’t have to predict this up move ahead of time!
Two Profit Targets to Exit Winners
Another difficult aspect of trading is trying to find the best place to exit winning trades. With the TOP BETT Strategy, you now have two strategically positioned profit targets to exit winning trades. Or, if you prefer, you can hold your trade until the close of the trading session. Once a trade becomes profitable, you’re in the driver’s seat!
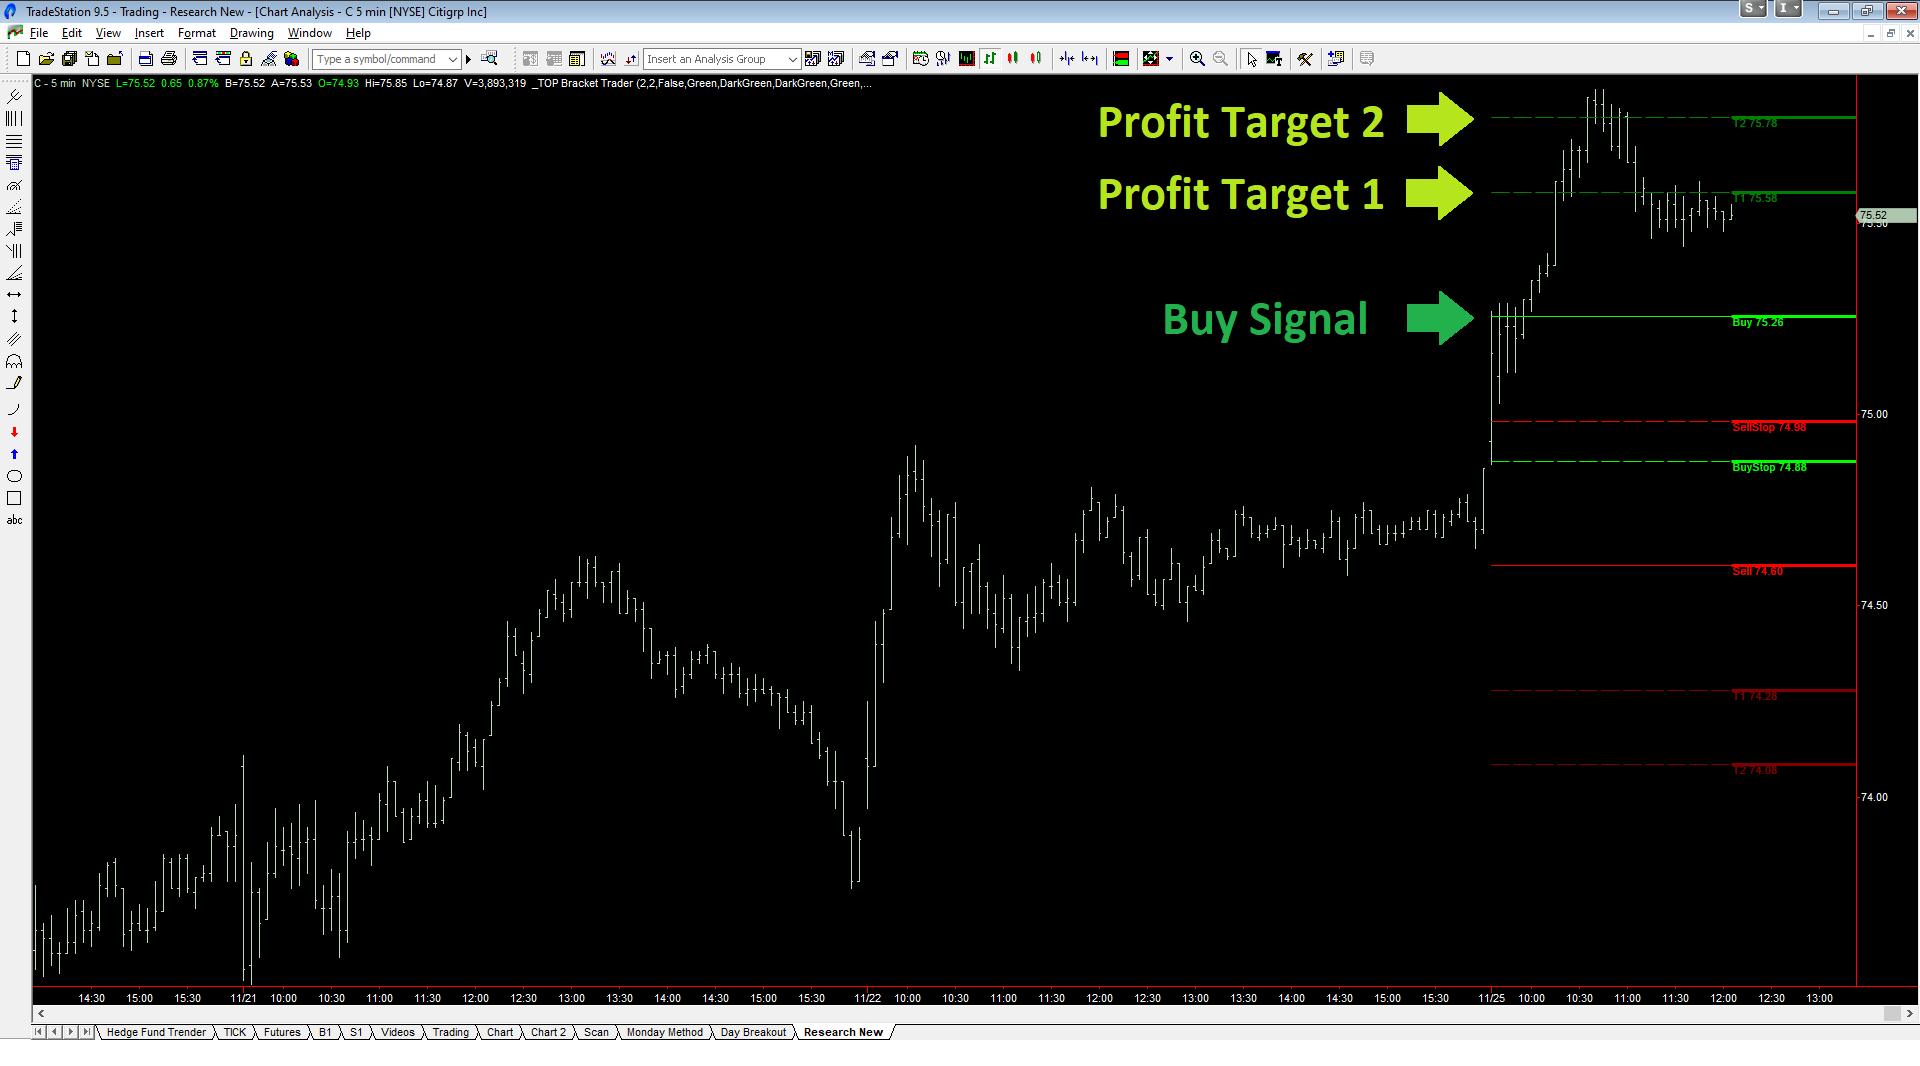
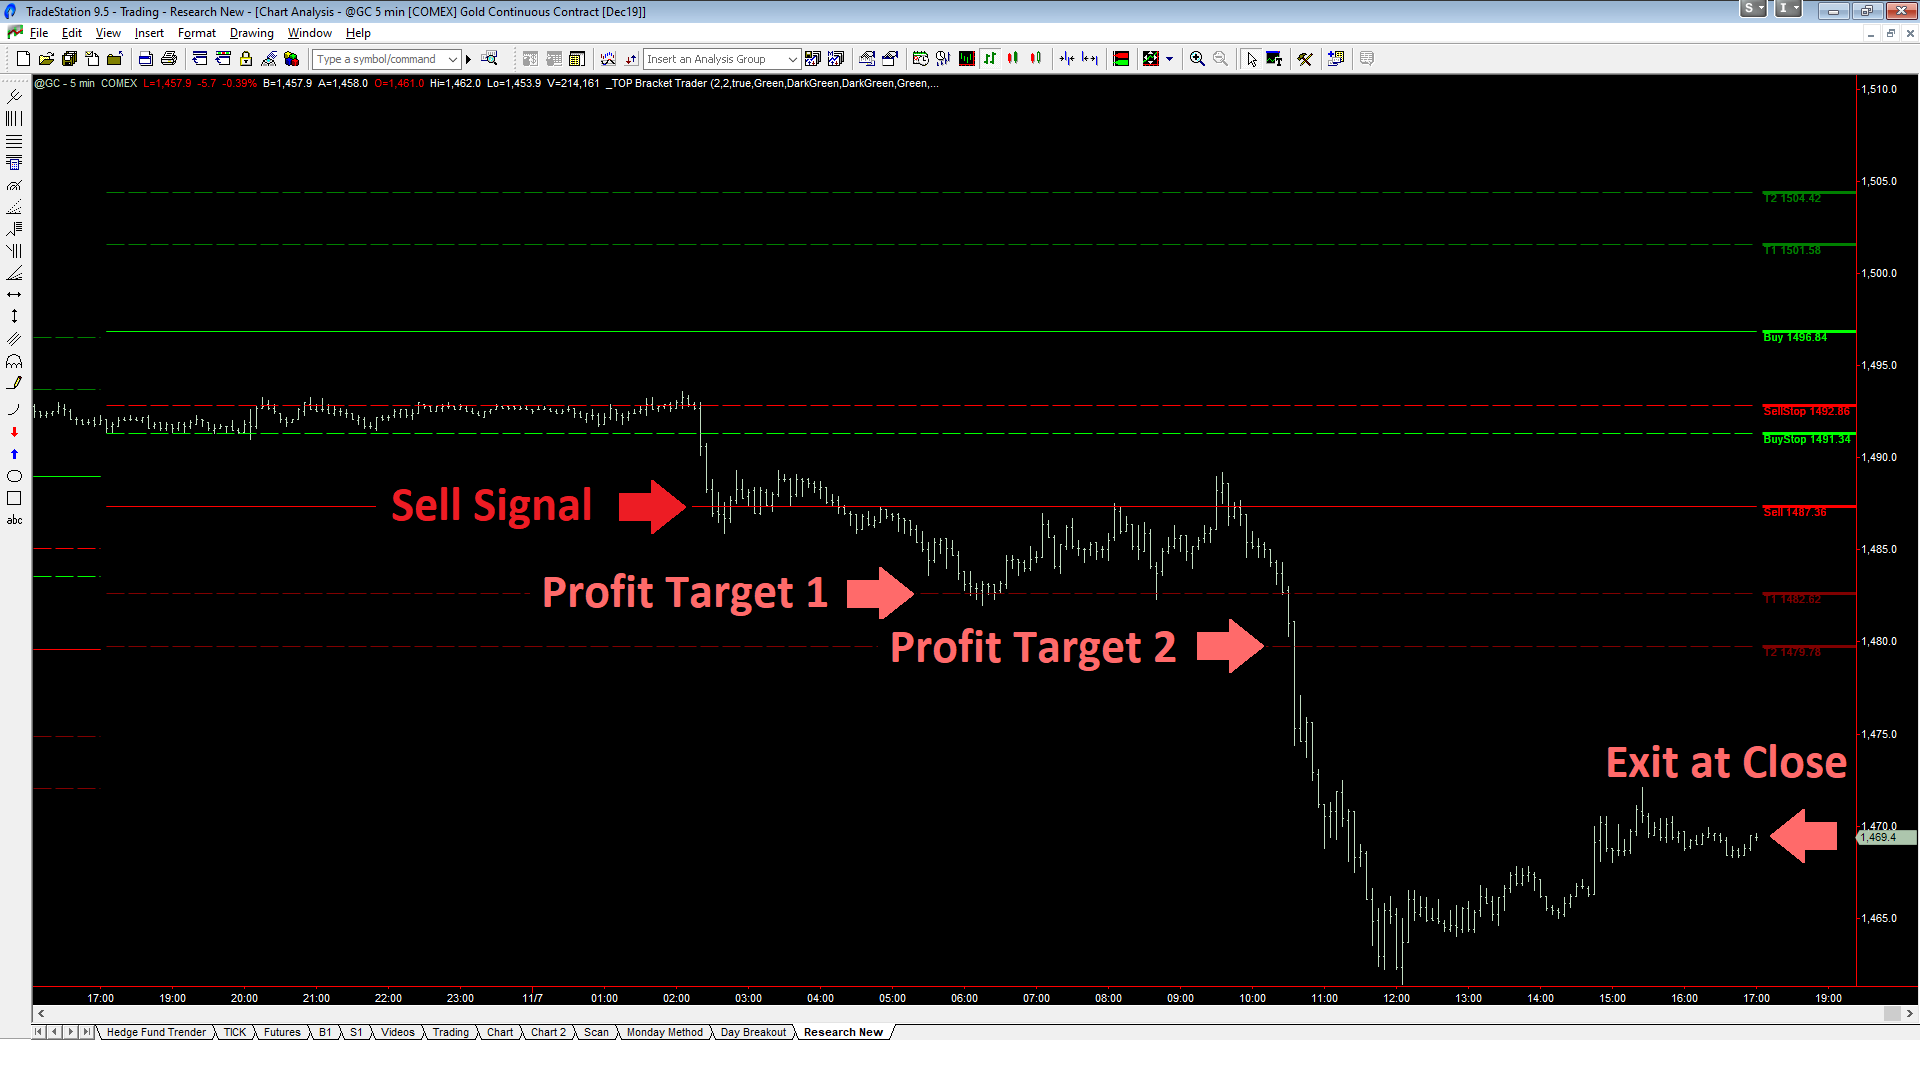
With the Top BETT Strategy, you have the option to exit winning trades at one of two strategically positioned profit targets, or you can hold your winner for bigger potential profits. In this example, you can see that both Profit Target 1 and Profit Target 2 were hit, giving you the ability to exit partial profits or close your trade at one of two clearly defined exit locations.
Now you can Profit from Falling Prices
The TOP BETT Strategy gives you the ability to potentially profit from both up moves and down moves in markets. This means that if prices start to fall for a market you trade, you can now use the TOP BETT Strategy to initiate a short position which allows you to profit from falling prices.
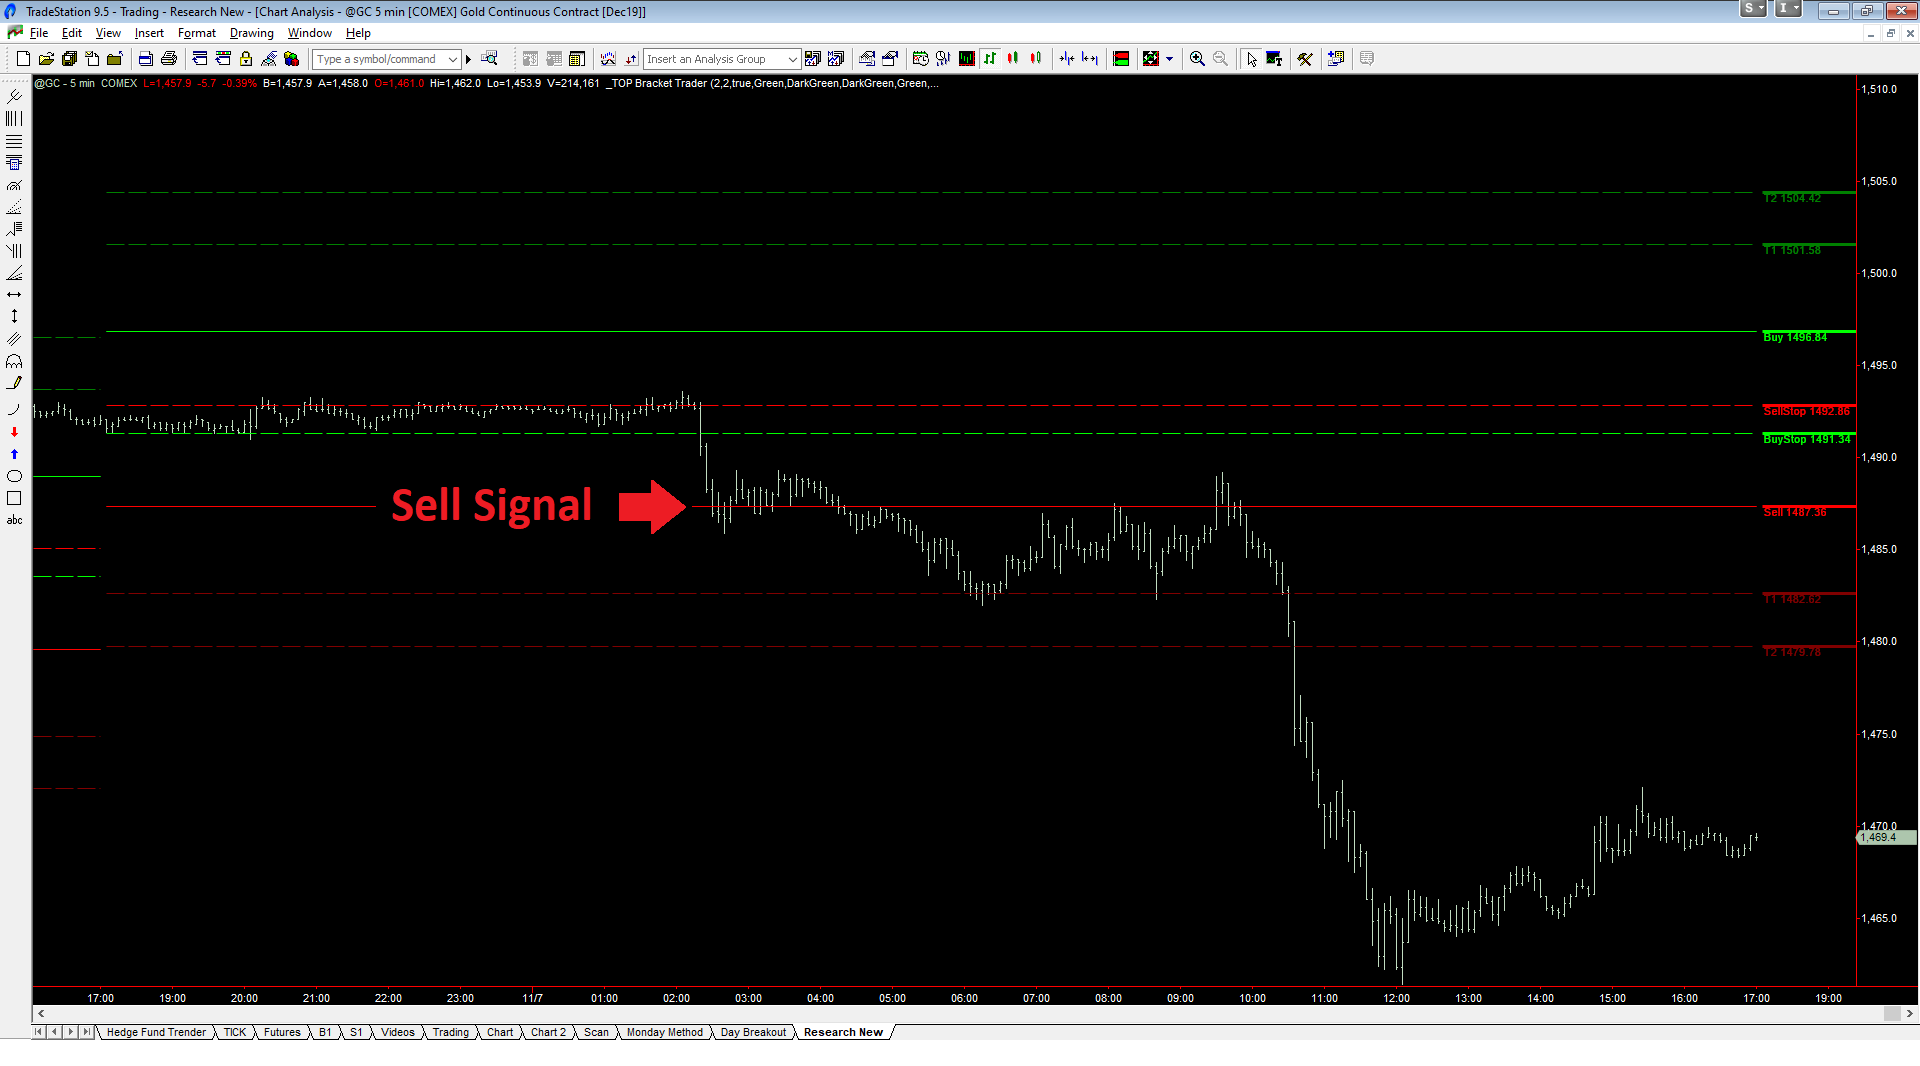
In the chart above, Gold futures started the session trading in a narrow range. Then, all of the sudden, heavy selling entered the Gold market causing Gold prices nosedive. With the TOP BETT Strategy you know to sell once it crosses red Sell Line (see red Sell Signal arrow). And you didn’t have to predict the direction of this big down move in Gold!
In this case, if you believed that Gold had more downside potential, you could hold your short position for potential larger profits. And, as it turned out, the selloff in Gold had a lot farther to go and your short trade exploded into a highly profitable trade.
Easy-to-Read Trading Signal Lines
Deciding where to enter and exit trades is a serious dilemma for traders. But now, that task is simple! With the TOP BETT Strategy, you can easily see where to enter and exit trades using the colored guidelines displayed right on your price chart.
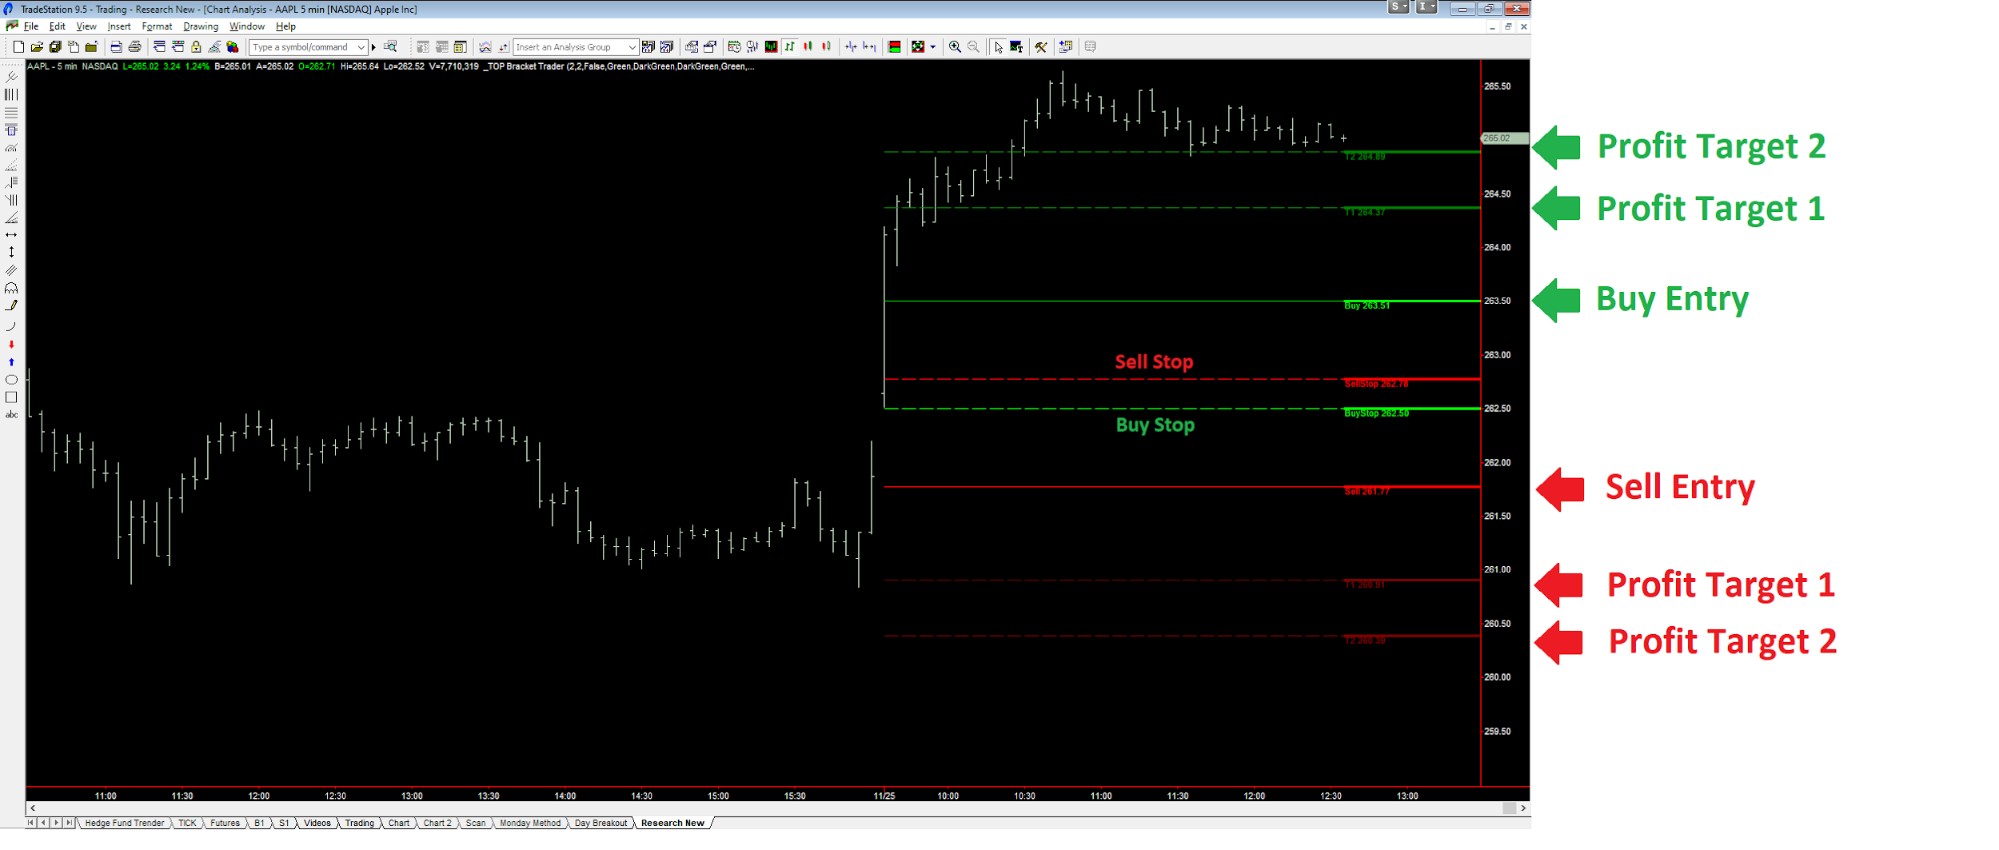
Notice in the price chart of Apple (AAPL) above, the TOP BETT Strategy provides strategically located Buy, Stop, and Target as well as Sell, Stop, and Target price levels, showing you where to enter and exit trades. Knowing where to exit losing trades is key to managing your account risk.
No Complicated Settings
One of our top priorities when developing the TOP BETT Strategy was to remove complicated parameter settings, which makes using this trading indicator super simple for any trader. You don’t have to worry about having the wrong settings for a parameter anymore, and you don’t have to invest large amounts of time understanding what each parameter is designed to do. All you have to do is apply the indicator to your chart and start using it!
Get the TOP BETT Strategy Advantage Today!
Regardless of what markets you trade, the TOP BETT Strategy can be a powerful addition to your trading toolbox. The TOP BETT Strategy can be used strategically to trade any market, including Stocks, Options, Futures, and FOREX. You get clear, unambiguous signals and you don’t have to guess the market direction when trading with the TOP BETT Strategy!
IMPORTANT NOTICE AND DISCLAIMER
Futures, Options, and Currency trading all have large potential rewards, but they also have large potential risk. You must be aware of the risks and be willing to accept them in order to invest in these markets. Don’t trade with money you can’t afford to lose. This website is neither a solicitation nor an offer to Buy or Sell stocks, options, futures, of FOREX. No representation is being made that any account will or is likely to achieve profits or losses similar to those discussed on this web site. The past performance of any trading system or methodology is not necessarily indicative of future results. TopTradeTools.com, including any of its affiliates, will not be liable for any indirect, incidental, or consequential losses or damages which may include but are not limited to any kind of losses or lost profits that may result from either technology or material. No representation is being made that the use of this strategy or any system or trading methodology will generate profits. Past performance is not necessarily indicative of future results. There is substantial risk of loss associated with trading securities and options on equities, options, futures, and FOREX markets. Only risk capital should be used to trade. Trading securities is not suitable for everyone. Disclaimer: posted on this website or in our presentations.
CFTC RULE 4.41 – HYPOTHETICAL OR SIMULATED PERFORMANCE RESULTS HAVE CERTAIN LIMITATIONS. UNLIKE AN ACTUAL PERFORMANCE RECORD, SIMULATED RESULTS DO NOT REPRESENT ACTUAL TRADING. ALSO, SINCE THE TRADES HAVE NOT BEEN EXECUTED, THE RESULTS MAY HAVE UNDER-OR-OVER COMPENSATED FOR THE IMPACT, IF ANY, OF CERTAIN MARKET FACTORS, SUCH AS LACK OF LIQUIDITY. SIMULATED TRADING PROGRAMS IN GENERAL ARE ALSO SUBJECT TO THE FACT THAT THEY ARE DESIGNED WITH THE BENEFIT OF HINDSIGHT. NO REPRESENTATION IS BEING MADE THAT ANY ACCOUNT WILL OR IS LIKELY TO ACHIEVE PROFIT OR LOSSES SIMILAR TO THOSE SHOWN.
The TOP Tick Trader (ColorBars) indicator has been designed to provide professional traders with the clearest picture of the stock market internals through the NYSE $TICK data, which tracks broad-based real-time stock market buying and selling activity. Finding trades is now made as easy as green bars “Buy” or red bars “Sell Short.”
Designed for trading Stocks, ETFs, and Options with a focus on the major stock market indices including the S&P 500 (SPY), Dow Jones Industrial Average (DIA), NASDAQ (QQQ), and the Russell 2000 (IWM). TOP Tick Trader is a powerful tool that can be used for Day Trading, Swing Trading, and for strategic Trend Trading! Designed to focus on intraday charts, including 1-minute charts, 5-minute charts (recommended), 15-minute, 30-minute, and 60-minute charts, to name a few.
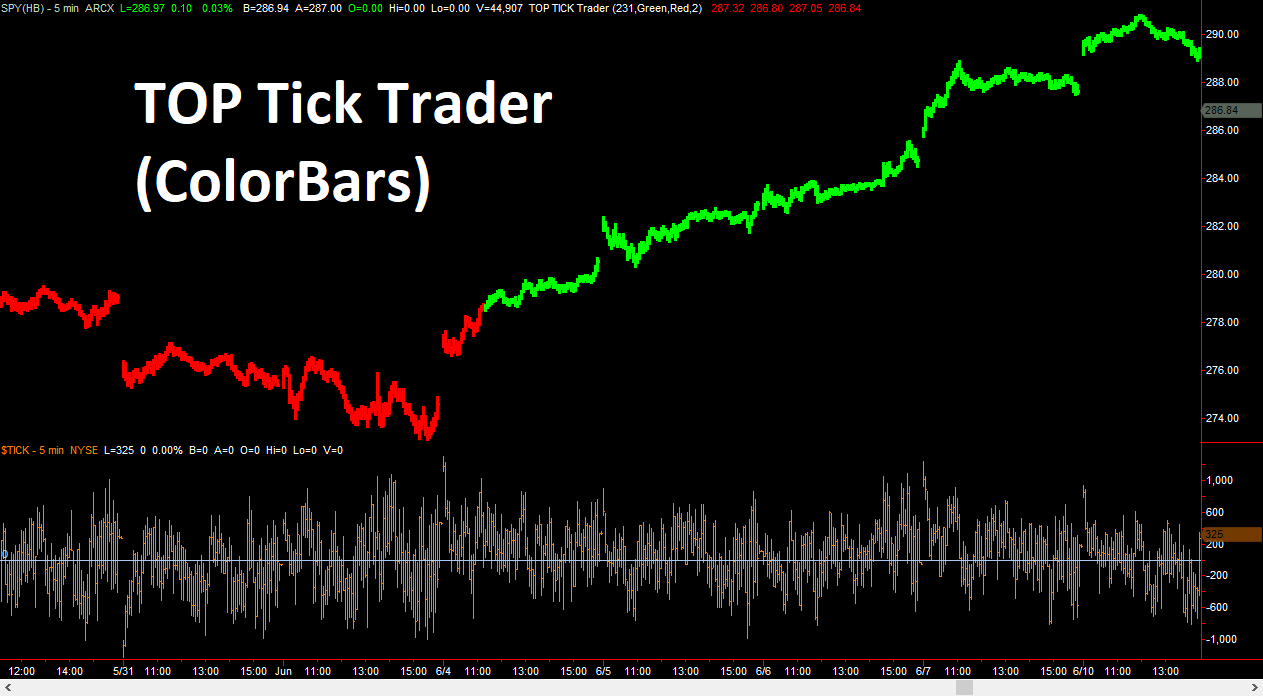
Most professional traders agree that a clear picture of the stock market internals is perhaps the best measure of stock market sentiment, giving traders a clear view of broad-based buying and selling activity in the stock market, which can be a powerful predictor of future price moves. The Tick Trader communicates the live broad-based trading actions of buyers and sellers in the stock market. Subtle changes in broad market buying and selling activity can provide powerful clues that the stock market is about to take off or possibly reverse direction. The TOP Tick Trader indicator has been designed to give professional traders a powerful advantage when trading stock market indices like the S&P 500, Dow Jones Industrial Average, NASDAQ, and the Russell 2000. The recommended bar interval is the 5-minute charts for Day Trading, Swing Trading, and even for strategic entry trend trading.
Easy to Read Shifts in Demand
When the buyers become more active in the stock market, prices typically go up. When sellers become more active in the stock market, prices typically go down. By tracking and displaying changes in the NYSE $TICK indicator market internals, the TOP Tick Trader makes it easy for you to see whether the buyers are stronger, or the sellers are stronger. When the stock market is experiencing broad-based buying, the TOP Tick Trader turns green, to indicate that the buyers are stronger and are in control. When the stock market is experiencing broad-based selling, the TOP Tick Trader turns red, to indicate that the sellers are stronger.
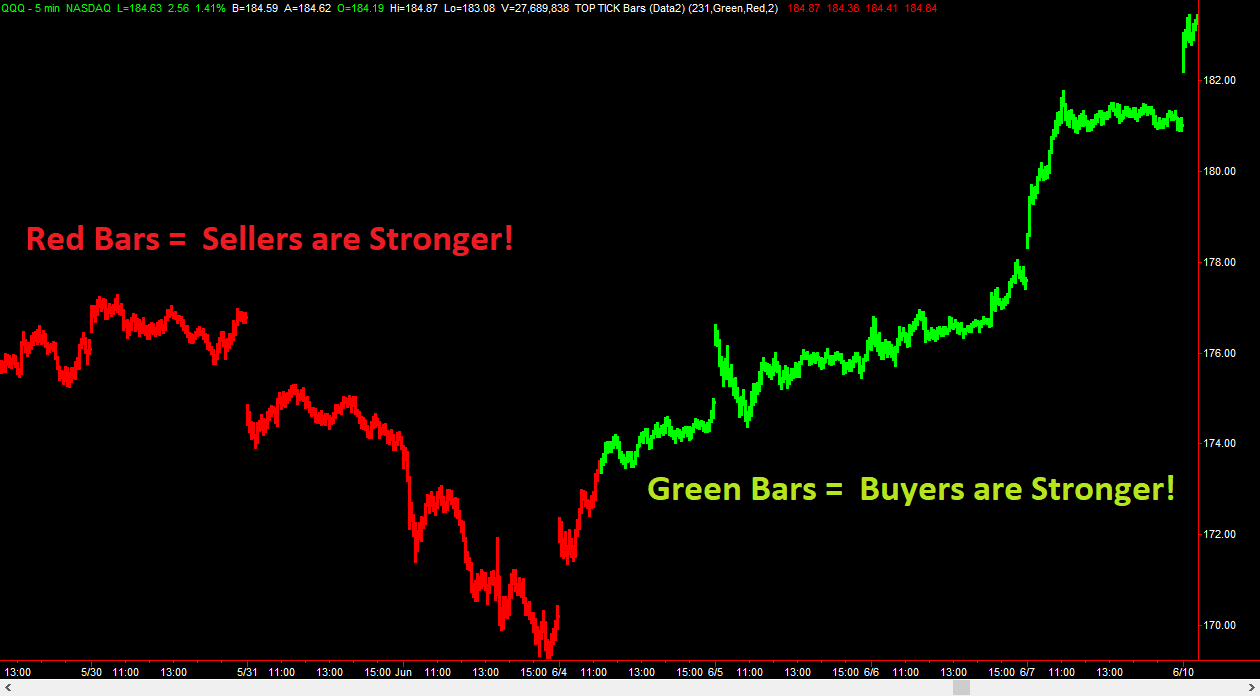
In the QQQ (NASDAQ ETF) 5-minute chart example above, you can clearly see how the TOP Tick Trader indicator shows us when the buyers are in control by painting the price bars green and when the sellers are in control by painting the price bars red. Using the powerful NYSE $TICK market trading data to detect broad-based buying or broad-based selling in the stock market, we can now jump on the side of the buyers (demand) when price bars are green or jump on the side of sellers (supply) when price bars are red.
Risk Disclaimer: There is a risk of loss in trading and past performance is not necessarily indicative of future results.
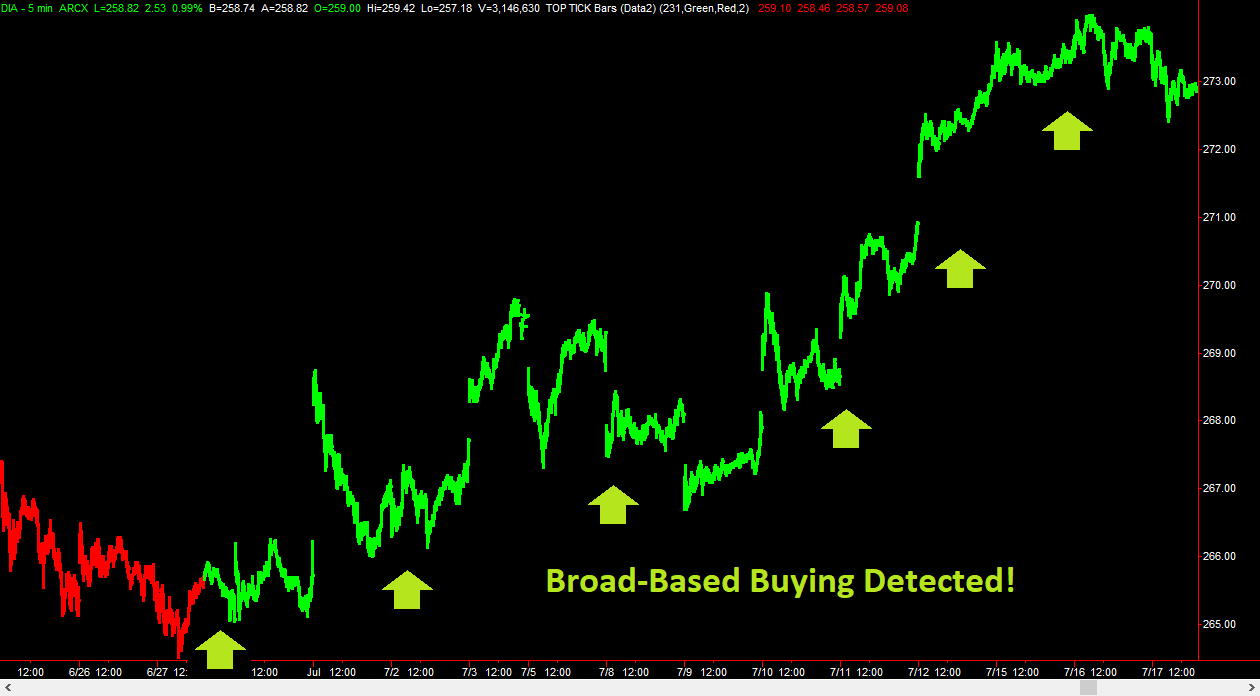
Many traders believe that the NYSE $TICK data, which is used by the TOP Tick Trader, is one of the best market sentiment indicators available. When market sentiment changes quickly, you need to be able to react quickly. Your ability to react quickly to changing market sentiment may be the difference catching big moves or missing out!
In the DIA (Dow Jones Industrial Average ETF) chart above, you can clearly see that the TOP Tick Trader shifts from red to green early on in the chart, indicating that the control has shifted from the sellers to the buyers. Once buyers took control, prices in the DIA proceed to rally from 266 all the way to 273! More demand and more buying activity typically results in higher prices.
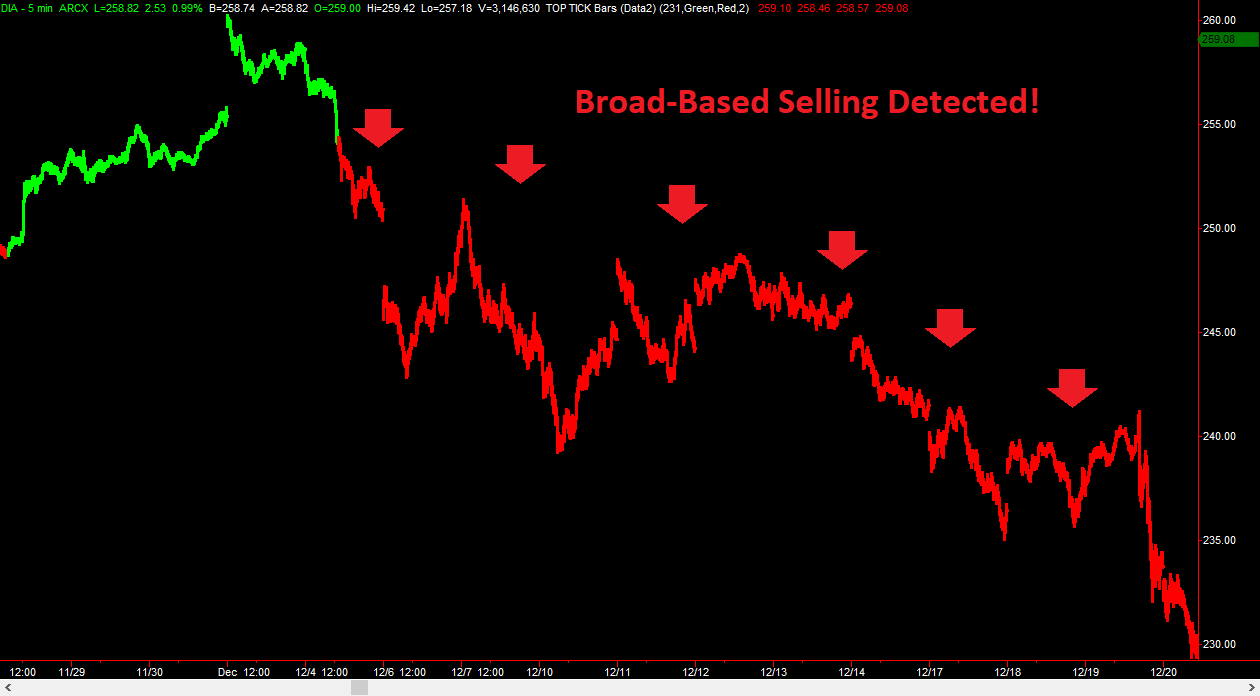
On the flip side, when broad-based selling is detected, the TOP Tick Trader turns red, alerting us to exit our long positions and look to join the sellers by selling short! You can see in the DIA 5-minute chart above prices get hammered after the sellers kick in (red bars), sending prices falling from 255 all the way to 230.
Trade the S&P 500, Dow Jones, NASDAQ, and Russell 2000 ETFs
The TOP Tick Trader gives you a powerful addition to your trading toolbox. By tracking the market internals, broad-based buying power in the stock market based on the NYSE $TICK, you can track and trade on the side of the dominant force – the buyers (green bars) or the sellers (red bars).
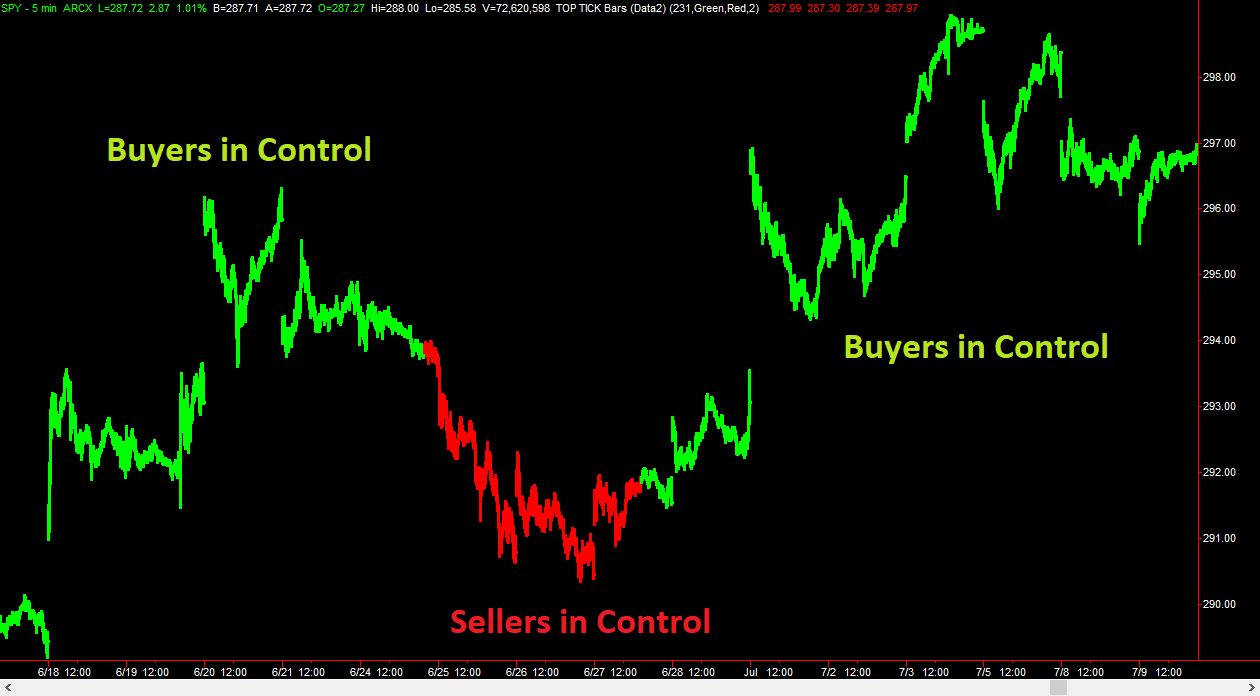
Regardless of the stock index you are trading, the TOP Tick Trader alerts you when the buyers are in control or when the sellers are in control, making the TOP Tick Trader an indicator you can use to signal when to buy or sell short the stock market.
Risk Disclaimer: There is a risk of loss in trading and past performance is not necessarily indicative of future results. Review the Hypothetical risk disclaimer RULE 4.41 at the bottom of the page.
Back Tested Results
In order to test the power of the TOP Tick Trader, we ran some tests to see if the TOP Tick Trader experienced profitable results over an extended 10-year period using 5-min charts. Commission and slippage fees were not considered in the results. We optimized the single input parameter for the S&P 500 over the testing period and the results were positive. Then we applied the same settings to tests for the DIA (Dow Jones Industrial Average), QQQ (NASDAQ), and the IWM (Russell 2000). These results were also impressive. See the test results for the TOP Tick Trader applied to the DIA using 5-minute price bars with the Lookback setting set to 57 bars trading 100 shares of the DIA ETF.
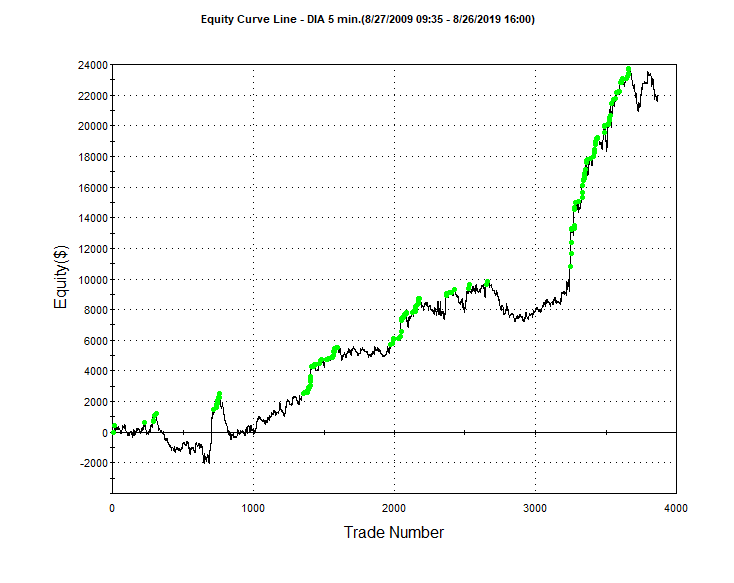
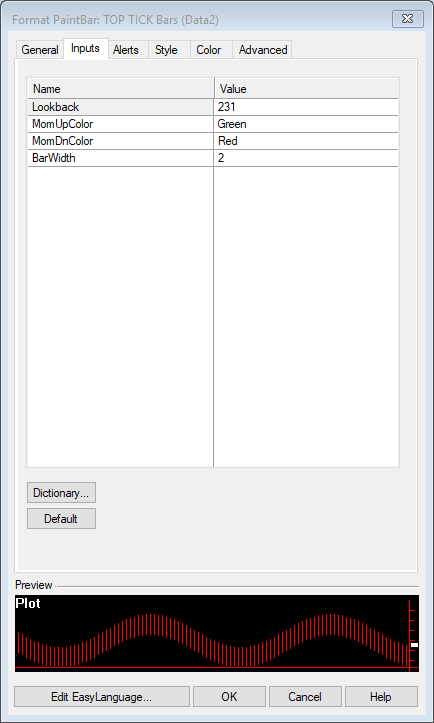
As you can see in the trading results graph above, the TOP Tick Trader was consistently profitable trading the DIA (Dow Jones Industrial Average ETF) for the 10-year period. Our testing shows the best two settings for the Lookback input parameter to be 57 or 231 (better in recent months).
Simple Indicator Parameters
We have designed the TOP Tick Trader indicator to be both powerful and easy to use. Our default settings represent our recommended settings. However, if you wish, you can adjust the TOP Tick Trader indicator settings to focus on longer-term or shorter-term market broad-based buying and selling by modifying the Lookback parameter. You can also set the colors of the price bars to match your personal chart color preferences.
Get the TOP Tick Trader Advantage Today!
Both new traders and professional traders alike can benefit from the power of the TOP Tick Trader indicator for day trading, swing trading, and strategic entry trend trading. The TOP Tick Trader indicator can be used to trade the S&P 500 (SPY), Dow Jones Industrial Average (DIA), NASDAQ (QQQ), and the Russell 2000 (IWM), including options on these indices. The TOP Tick Traders also worked well on the FAANG stocks in our testing. Now you can learn to find when the buyers are stronger or when the sellers are stronger with the TOP Tick Trader indicator. Get the professional grade TOP Tick Trader advantage now. Click the button below to begin enjoying the TOP Tick Trader indicator today!
IMPORTANT NOTICE AND DISCLAIMER
Futures, Options, and Currency trading all have large potential rewards, but they also have large potential risk. You must be aware of the risks and be willing to accept them in order to invest in these markets. Don’t trade with money you can’t afford to lose. This website is neither a solicitation nor an offer to Buy or Sell stocks, options, futures, of FOREX. No representation is being made that any account will or is likely to achieve profits or losses similar to those discussed on this web site. The past performance of any trading system or methodology is not necessarily indicative of future results. TopTradeTools.com, including any of its affiliates, will not be liable for any indirect, incidental, or consequential losses or damages which may include but are not limited to any kind of losses or lost profits that may result from either technology or material. No representation is being made that the use of this strategy or any system or trading methodology will generate profits. Past performance is not necessarily indicative of future results. There is substantial risk of loss associated with trading securities and options on equities, options, futures, and FOREX markets. Only risk capital should be used to trade. Trading securities is not suitable for everyone. Disclaimer: posted on this website or in our presentations.
CFTC RULE 4.41 – HYPOTHETICAL OR SIMULATED PERFORMANCE RESULTS HAVE CERTAIN LIMITATIONS. UNLIKE AN ACTUAL PERFORMANCE RECORD, SIMULATED RESULTS DO NOT REPRESENT ACTUAL TRADING. ALSO, SINCE THE TRADES HAVE NOT BEEN EXECUTED, THE RESULTS MAY HAVE UNDER-OR-OVER COMPENSATED FOR THE IMPACT, IF ANY, OF CERTAIN MARKET FACTORS, SUCH AS LACK OF LIQUIDITY. SIMULATED TRADING PROGRAMS IN GENERAL ARE ALSO SUBJECT TO THE FACT THAT THEY ARE DESIGNED WITH THE BENEFIT OF HINDSIGHT. NO REPRESENTATION IS BEING MADE THAT ANY ACCOUNT WILL OR IS LIKELY TO ACHIEVE PROFIT OR LOSSES SIMILAR TO THOSE SHOWN.
